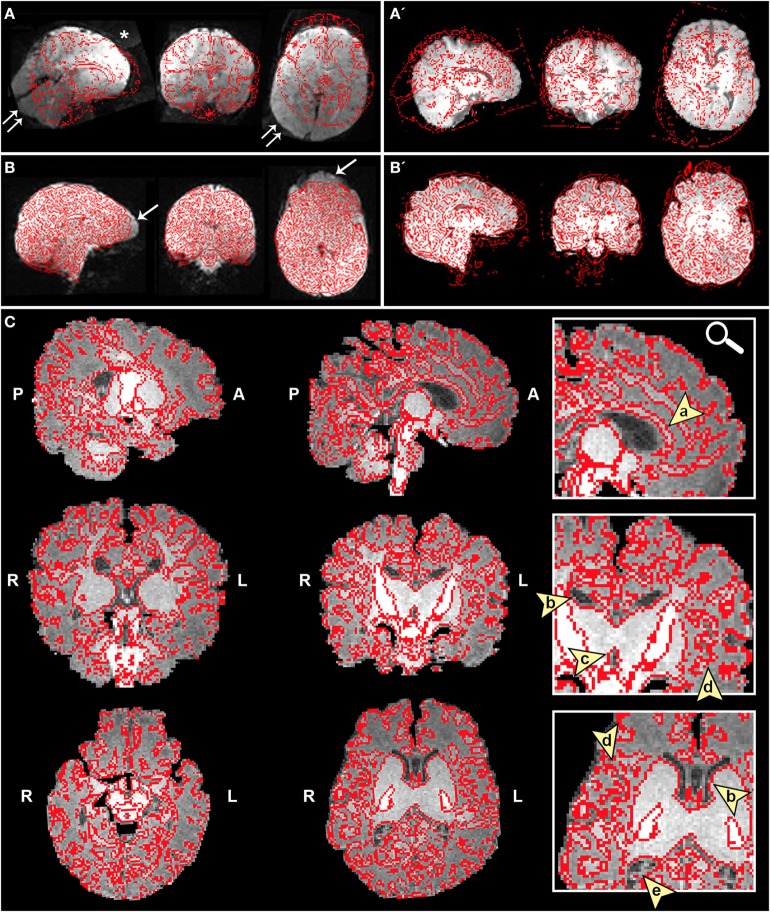
Figure 4.
Registration of functional magnetic resonance imaging (fMRI) image to native space. Figure illustrates examples of poor (A and A′) and reasonable (B and B′) registration of fMRI data to native space as they appear in the Melodic report, using representative ex-33-week premature infant scanned at 4-weeks corrected age (2.75 months postnatal age) and full-term infant scanned at 5 months of age, respectively. Each row shows structural-to-functional image alignment in parasagittal, coronal, and axial views (from left to right). In panels (A) and (B), fMRI image is shown in gray-scale, while overlying red contours delineate corresponding structural Reference image (also referred to as infant’s native space). In panels (A′) and (B′), this relationship is reversed (i.e., red contour represents functional image). Panel (A) illustrates poor functional-to-structural image alignment, likely precipitated in part by magnetic field inhomogeneity (i.e., susceptibility effects). The latter causes apparent EPI-related distortions (double arrows), negatively influencing registration. Misalignment presents as improper/absent contours delineating gray and white matter boundaries, ventricles, and outline of the brain (best viewed in coronal sections). Note the common echo-planar imaging (EPI) sequence artifact referred to as “ghosting” (white asterisk). In panel (B), registration results demonstrate reasonable alignment, with minor distortion artifact noted in the orbitofrontal region (single arrows) that are commonly observed in regions adjacent to air-tissue interfaces like the nasal cavity and sinuses (72). For coronal and transverse sections, left hemisphere of the brain corresponds to the right side of the image. Panel (C) illustrates an alternative method for visualizing registration results post-independent component analysis using representative ex-25-week premature infant scanned at term-equivalent age (4.25 months postnatal age; see also Figure 8). White matter contours of functional data are shown in red overlaid on high-resolution structural T1 image, with arrowheads highlighting good structural-to-functional overlap of tissue boundaries (a, corpus callosum; b, body of lateral ventricles; c, third ventricle; d, insular cortex; e, occipital horns of lateral ventricles). Abbreviations: A, anterior; L, left; P, posterior; R, right.

