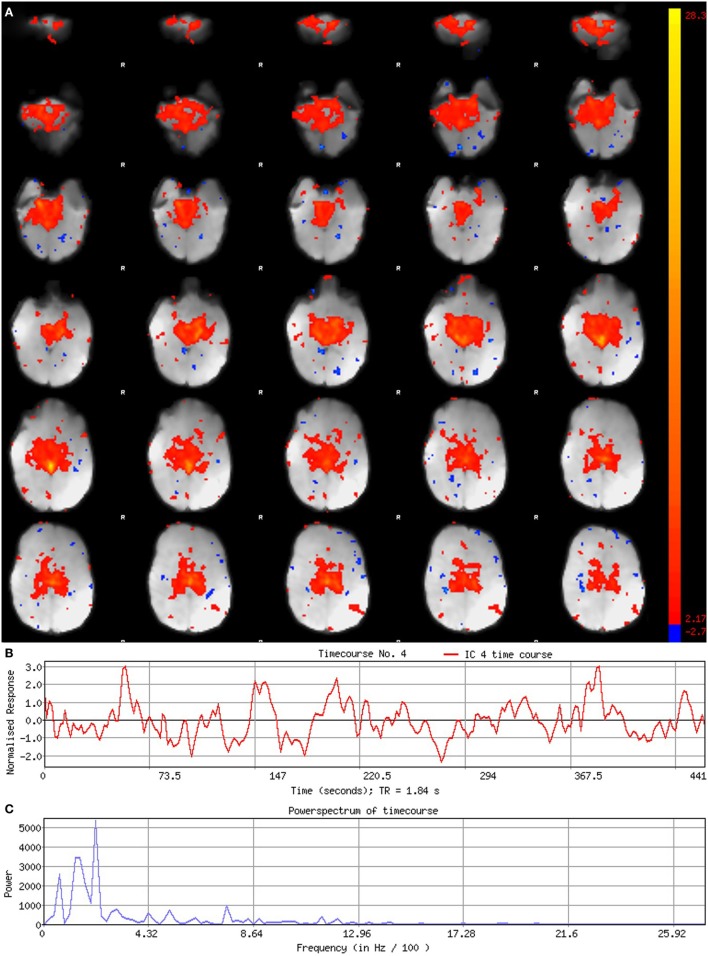
Figure 5.
Signal component. Figure illustrates representative signal component obtained from final analysis of an ex-33-week premature infant scanned at 4-weeks corrected age (2.75 months postnatal age). Panel (A) shows component’s spatial map, presented in the Melodic report as z-scores superimposed on serial axial sections of mean functional image in radiological convention (right side of image corresponds to left side of brain). Its spatial distribution demonstrates gradual change through progressive sections, encompassing biologically relevant structures consistent with the cerebellar-subcortical network (also shown in Figure 8). In panel (B), the component’s associated timecourse follows a regular, oscillatory pattern, with no sudden spikes. The power spectrum in panel (C) shows a predominance of high power at low frequencies, characteristic of resting-state neural networks.

