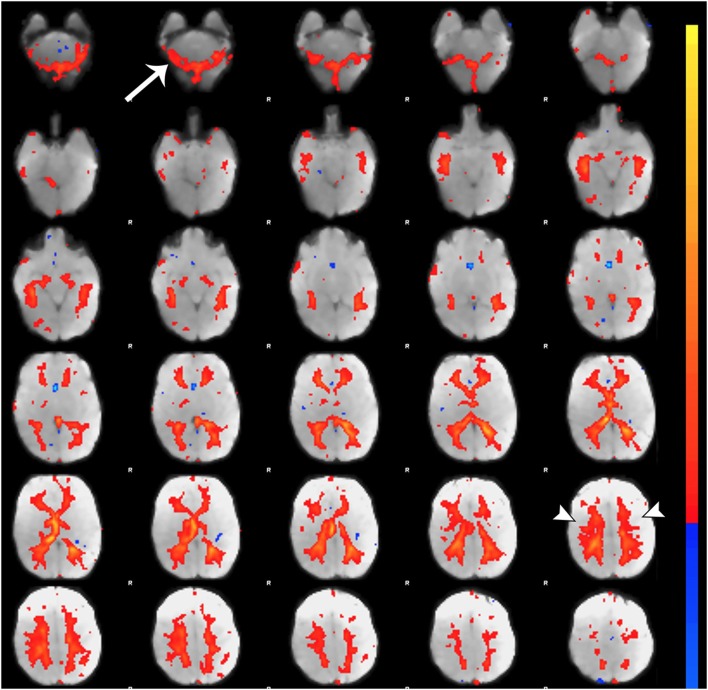
Figure 7.
Noise component related to subependymal and transmedullary veins. Figure illustrates representative noise component in Melodic report obtained from final analysis of an ex-33-week premature infant scanned at 9-weeks corrected age (4 months postnatal age). X-shaped spatial distribution generated by pulsation in subependymal and to a lesser degree transmedullary veins (85, 86). These components are often mistaken for white matter components (arrowheads) due to the effect of spatial smoothing on signal distribution (74). Note the presence of rim-like activity in lower slices near the cerebellum (single arrow), which is a common finding in noise components. Melodic report spatial map is presented as z-scores superimposed on mean functional image in radiological convention (right side of image corresponds to left side of brain).

