Figure 8.
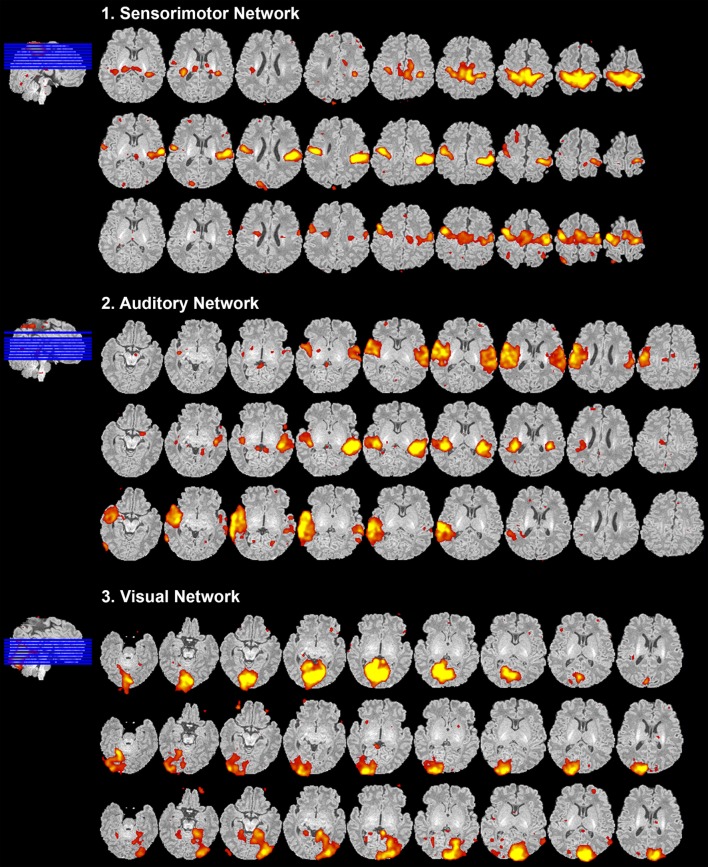
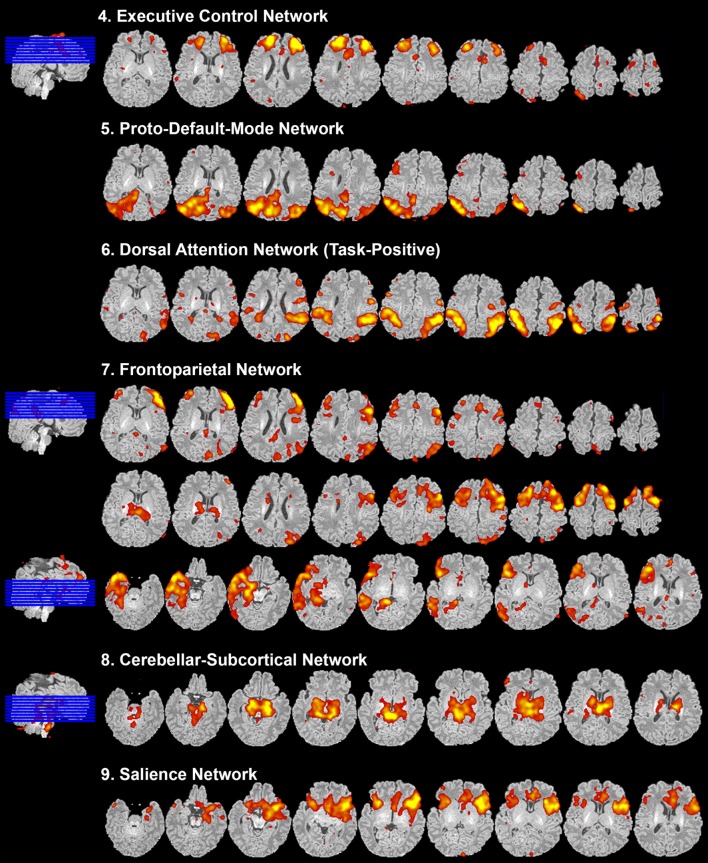
Resting-state network data presentation. Figure illustrates representative neural components (18 out of 40) comprising eight total resting-state networks obtained from final analysis of an ex-25-week premature infant scanned at term-equivalent age (4.25 months postnatal age). Identified networks were as follows: (1) sensorimotor, (2) auditory, (3) visual, (4) executive control, (5) proto-default-mode, (6) dorsal attention, (7) frontoparietal, (8) cerebellar-subcortical, and (9) salience networks. Identified networks were spatially consistent with those previously described in infants (22, 25–29, 32, 33, 87–89) and adults (11, 90, 91). Spatial maps are presented as z-scores (arbitrarily thresholded at z = 2.8) superimposed on corresponding structural Reference image, and presented in serial axial view using MRIcron. Slices progress from ventral to more dorsal sections (left to right). In accordance with traditional radiological convention, right side of image corresponds to left side of brain.


