Fig. 10.

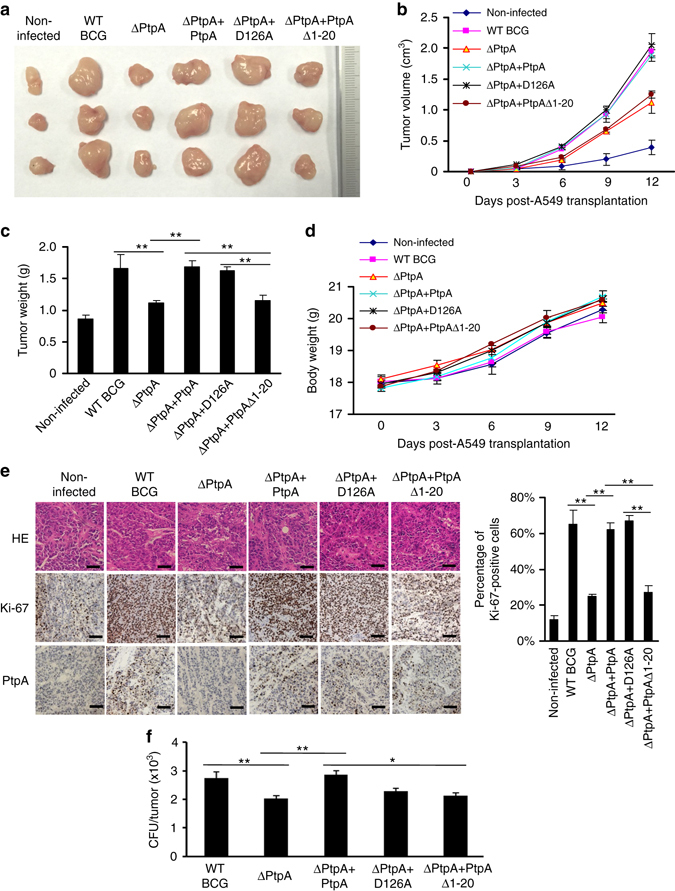
PtpA promotes tumor growth in nude mice. a Photograph of tumors. Tumors were derived from non-infected A549 cells or cells infected with WT BCG, BCG ΔPtpA, BCG (ΔPtpA + PtpA), BCG (ΔPtpA + D126A), or BCG (ΔPtpA + PtpA Δ1-20) in BALB/c nude mice. b Tumor growth curve in nude mice. After tumor cells were injected subcutaneously into the right armpit of nude mice, the short and long diameters of the tumors were measured every 3 days and tumor volumes (cm3) were calculated. c Weight of tumors in nude mice. d Time course of the body weight of the mice. e Representative hematoxylin-eosin (H&E) staining histopathologic images of tumor tissues from mice (upper panels) and the immunohistochemical analysis of Ki-67 (middle panels) and PtpA in tumors (lower panels). Scale bars, 200 μm. Right, percentage of Ki-67-positive cells in the tumors. About 200 cells were counted. f Bacterial load in homogenates of tumors from nude mice killed 12 days after tumor inoculation. The average number of CFU per tumor was calculated. *P < 0.05 and **P < 0.01 (unpaired two-tailed Student’s t-test). Data are representative of one experiment with two independent biological replicates (b–f; mean and s.e.m. of n = 6 mice per group)
