Fig. 2.

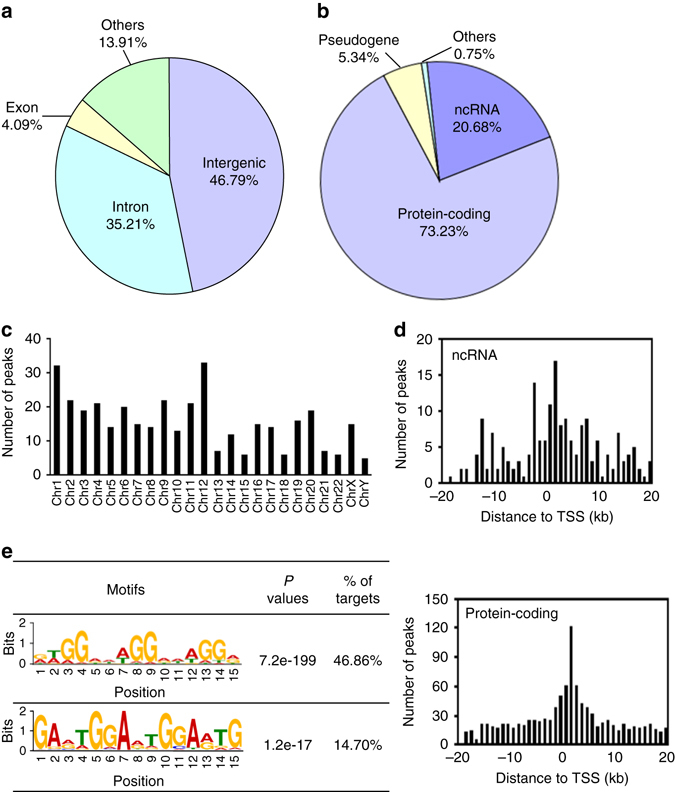
Genome-wide analysis of potential PtpA-binding sites in U937 cells. a Genomic distribution of potential PtpA-binding regions in U937 cells. b Biotype distribution of potential PtpA-binding regions in U937 cells. c Distribution of the chromosomal location of PtpA-specific ChIP-seq signals (fold-enrichment > 10). d The number and position of the potential PtpA-binding sites along 20 kb from the nearest TSS of the ncRNAs or protein-coding genes, respectively. e PtpA consensus motifs defined by MEME motif analysis of the sequences of PtpA ChIP-seq peaks. P values were calculated by TOMTOM match statistics. “% of targets” represents the percentage of motif-containing fractions in potential PtpA targets. The size of each letter was proportional to the frequency of each nucleotide in that position within the consensus motif
