Fig. 9.

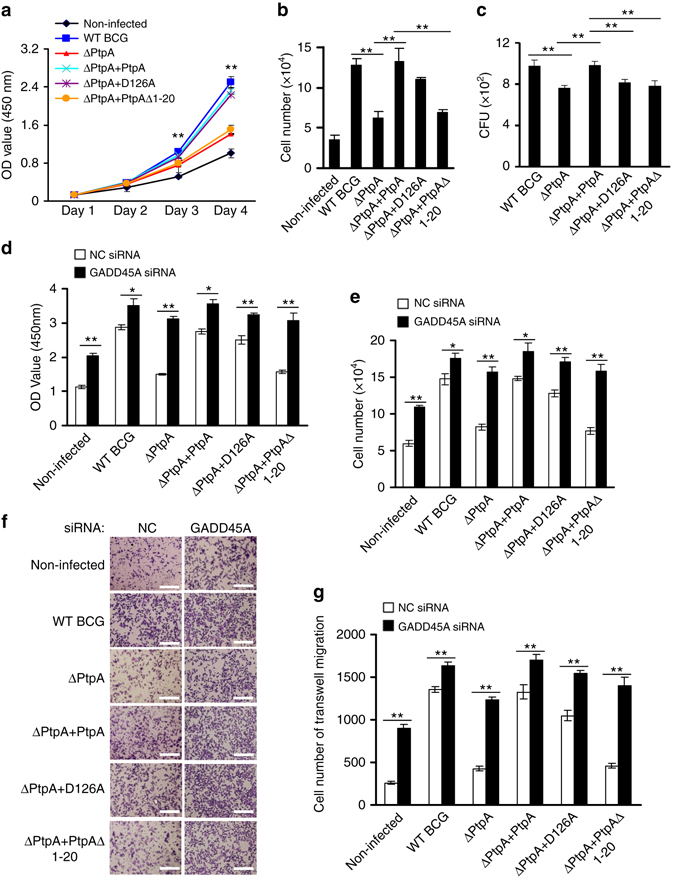
PtpA promotes A549 cell proliferation and migration in a DNA-binding-dependent manner. a, b. CCK-8 assay of A549 cells. Cells were infected with WT BCG, BCG ΔPtpA, BCG (ΔPtpA + PtpA), BCG (ΔPtpA + D126A), or BCG (ΔPtpA + PtpA Δ1-20) at a MOI of 10 for 0–4 days, and then the OD450 value was measured and cell numbers were calculated. c Survival of BCG strains in U937 cells infected as in a, b for 4 days. d, e CCK-8 assay of A549 cells with GADD45A knock-down. Cells were transfected with negative control RNA (NC RNA) or GADD45A-specific siRNA, followed by infection with WT BCG, BCG ΔPtpA, BCG (ΔPtpA + PtpA), BCG (ΔPtpA + D126A), or BCG (ΔPtpA + PtpA Δ1-20) at a MOI of 10 for 96 h, and then the OD450 value was measured and cell numbers were calculated. f, g Transwell migration assay of A549 cells with GADD45A knock-down. Cells were transfected with siRNAs and infected with BCG strains as in d, then the cells were allowed to migrate on transwell inserts for 12 h. The cells that had migrated through the filter into the lower wells were quantitated by Crystal Violet assay f and were expressed as the total cell numbers of lower wells g. Scale bars, 200 μm. *P < 0.05 and **P < 0.01 (unpaired two-tailed Student’s t-test). Data are representative of one experiment with at least three independent biological replicates (a–e, g; mean and s.e.m., n = 3)
