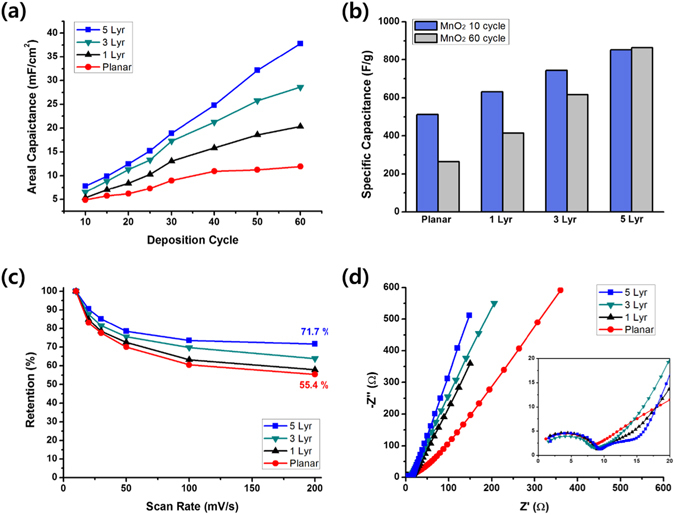
Figure 4.

Electrochemical characterization of MnO2 electrodes at various numbers of electrodepoistion cycles and scan rates. (a) Plots of the areal capacitance as a function of the number of MnO2 electrodeposition cycles and (b) bar graphs of the specific capacitances after 10 and 60 electrodeposition cycles. The scan rate was 100 mV s−1 for these measurements. (c) Plots of specific capacitance retentions as a function of the scan rate and (d) Nyquist plots for the planar and nanostructured electrodes. The number of MnO2 electrodeposition cycles was 60 for these measurements.
