
Figure 1.
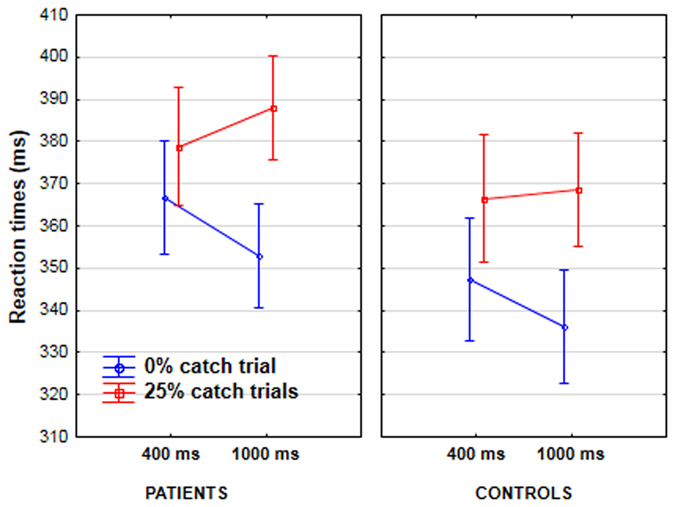
Reaction times in patients (lefthand graph) and controls (righthand graph) as a function of target condition (0% catch trial in blue, vs. 25% catch trials in red), and the foreperiod between the cue and the target (400 vs. 1000 ms).
Official websites use .gov
A
.gov website belongs to an official
government organization in the United States.
Secure .gov websites use HTTPS
A lock (
) or https:// means you've safely
connected to the .gov website. Share sensitive
information only on official, secure websites.
Reaction times in patients (lefthand graph) and controls (righthand graph) as a function of target condition (0% catch trial in blue, vs. 25% catch trials in red), and the foreperiod between the cue and the target (400 vs. 1000 ms).