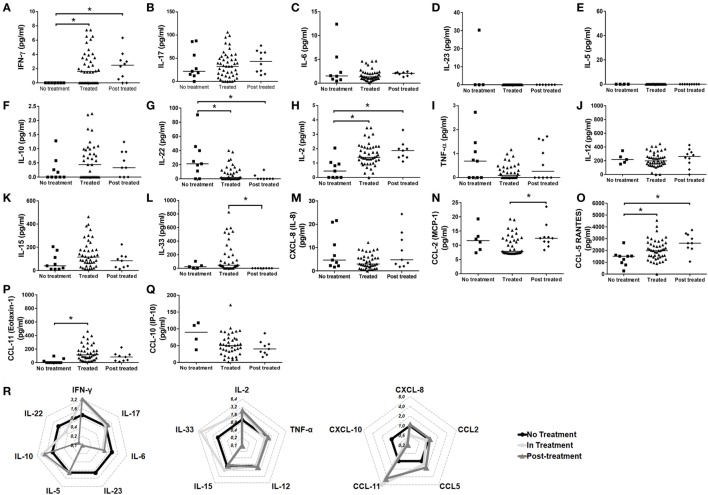
Figure 4.
Cytokine and chemokine interplay after treatment with immunosuppressant drugs. Levels of (A) IFN-γ, (B) IL-17, (C) IL-6, (D) IL-23, (E) IL-5, (F) IL-10, (G) IL-22, (H) IL-2, (I) TNF-α, (J) IL-12, (K) IL-15, (L) IL-33, (M) CXCL-8/IL-8, (N) CCL-2/MCP-1, (O) CCL-5/RANTES, (P) CCL-11/eotaxin-1, and (Q) CXCL-10/IP-10 from patients with the endemic form (fogo selvagem—FS) of pemphigus foliaceus under different conditions of treatment (no treatment, treated, and post-treatment). Lines represent median. *p < 0.05, Kruskal–Wallis test followed by Dunn’s test. (R) Radar plot representation of serum cytokine and chemokine profile of not treated (black lines), in treatment (light gray) and post-treatment (dark gray) FS patients. Data were obtained by calculating the ratio between the median concentrations of each cytokine in the pemphigus foliaceus (FS) patients under- or post-treatment versus the untreated group.

