FIGURE 3.
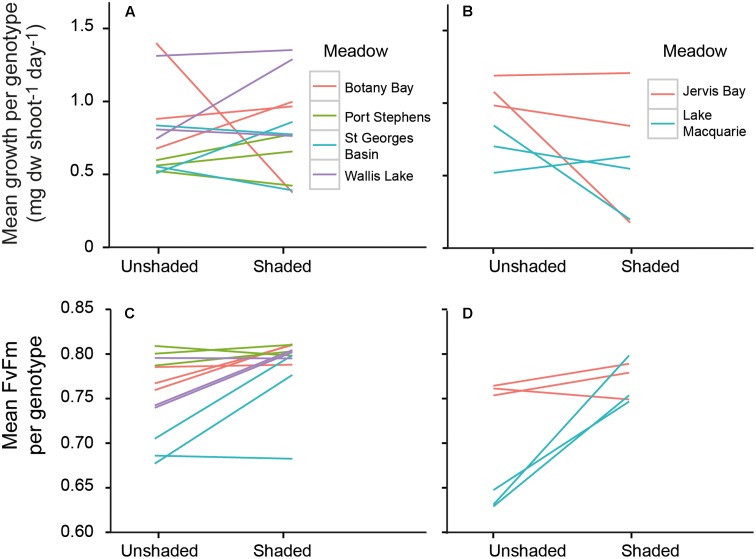
Reaction norms of individual genotypes across shaded and control treatments for growth rates (top panel) and photosynthetic efficiency (bottom panel) of genotypes from Wallis Lake, Port Stephens, Botany Bay, and St. Georges Basin (A,C), and Lake Macquarie (dark gray lines) and Jervis Bay (dashed lines) (B,D). Lines join the mean response for each genotype across the two light environments.

