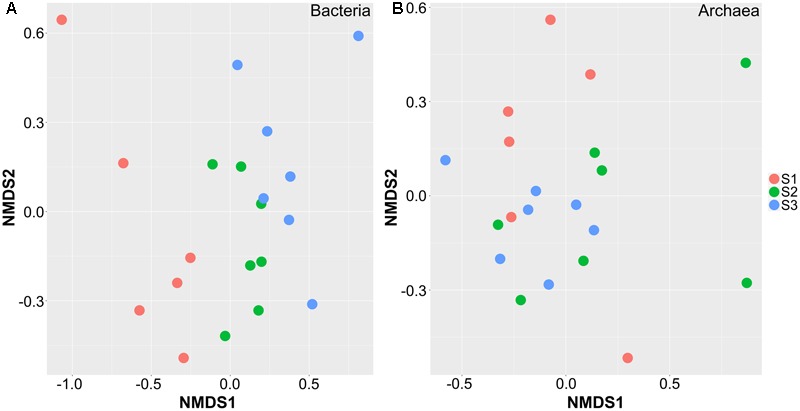
FIGURE 1.

Non-metric multidimensional scaling plot showing the separation of samples from cattle in different age groups. These samples are separated based on the composition of OTUs in bacteria (A) and archaea (B). S1 indicates heifers (9–10 months); S2 indicates young adults (45–65 months); S3 indicates older adults (96–120 months).
