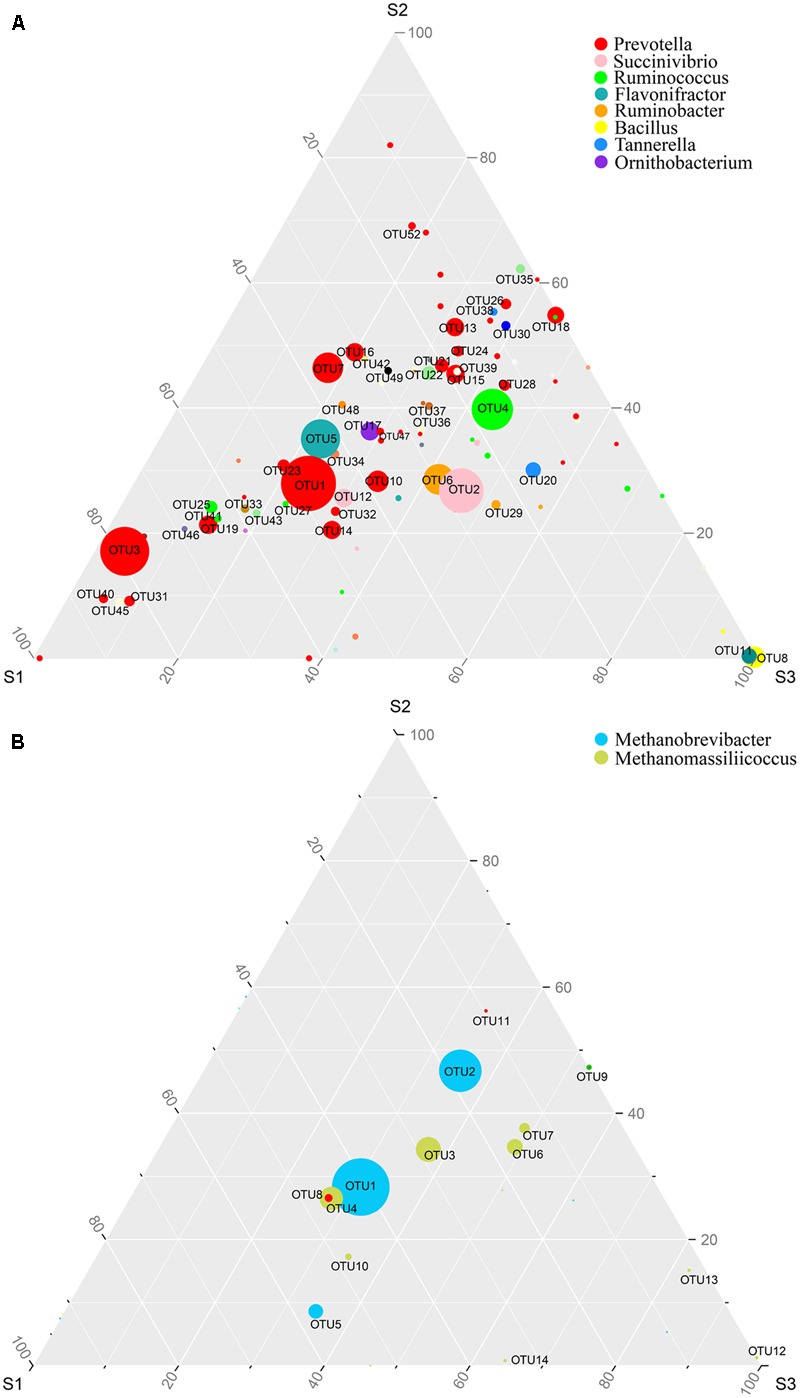
FIGURE 2.

The distribution of microbial OTUs among different age groups. Ternary plot shows the comparative abundances of the top 100 bacterial taxa (A) and archaeal taxa (B) at OTU level shared among S1 (9–10 months), S2 (45–65 months), and S3 (96–120 months) age groups. The sum of the abundance for any one phylotype in these three groups is set as 100%. Symbol size reflects relative abundance of different genera.
