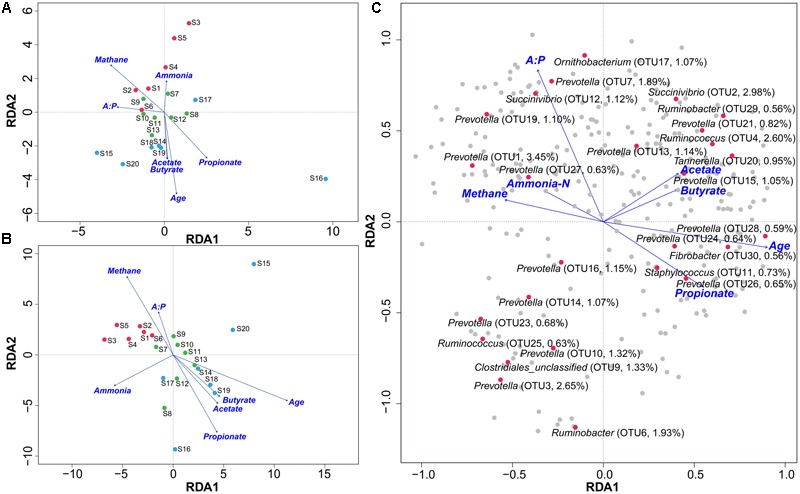
FIGURE 3.

Effects of environmental variables on sample separation and microbial distribution using RDA. Bi–plot shows the relationships between samples and environmental factors, including ammonia–N, methane, A:P ratio, age, and VFAs at the genus (A) and phylotype (B) levels from cattle in the S1, S2, and S3 groups. Red dots indicate S1, green S2, and blue S3 groups. The relationships between predominant phylotypes and environmental factors are shown at phylotype level (C). Red dots indicate predominant phylotypes. S1 indicates heifers (9–10 months); S2 indicates young adults (45–65 months); S3 indicates older adults (96–120 months).
