FIGURE 4.

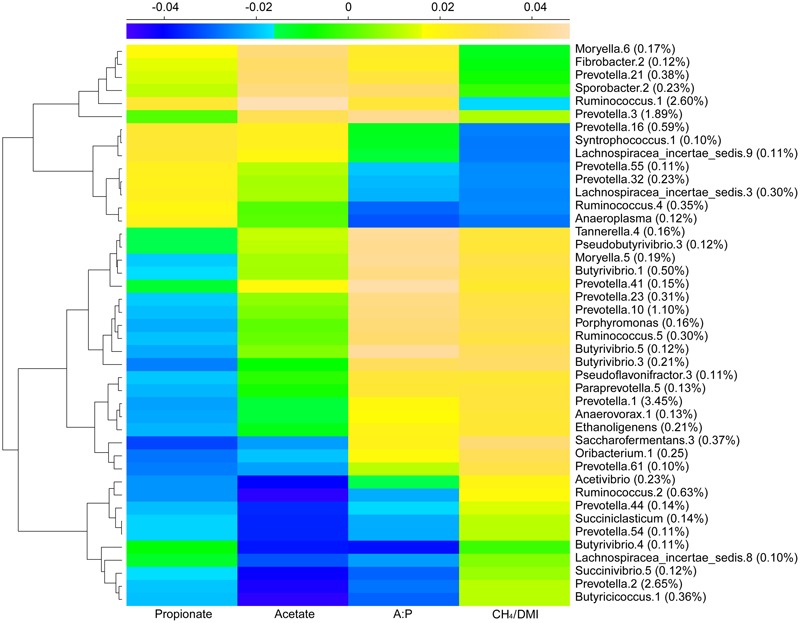
Dominant microbial OTUs related to VFAs and methane production using sPLS regression analysis. A heatmap based on coefficients represents the regression relationship between methane, VFAs and bacterial phylotypes with abundance > 0.1%.

Dominant microbial OTUs related to VFAs and methane production using sPLS regression analysis. A heatmap based on coefficients represents the regression relationship between methane, VFAs and bacterial phylotypes with abundance > 0.1%.