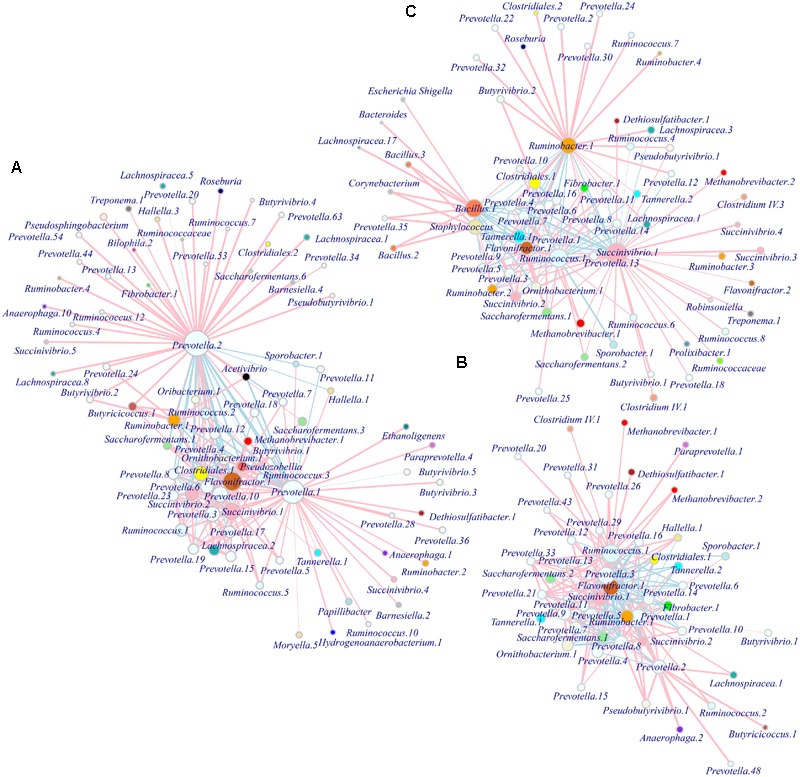
FIGURE 5.

Patterns of microbial interactions in different age range. Networks are based on the adjacency matrix of microbial abundance and correlation analysis at the OTU level for groups S1 (A), S2 (B), and S3 (C), respectively. The nodes represent microbial OTUs and the edges represent the correlation coefficients. The color and width of the lines indicate the direction (pink positive, light blue negative) and strength of the correlation between different microbial OTUs, respectively. The sizes of the nodes indicate the mean average abundance and the vertices representing OTUs within the same genus are colored the same. S1 indicates heifers (9–10 months); S2 indicates young adults (45–65 months); S3 indicates older adults (96–120 months).
