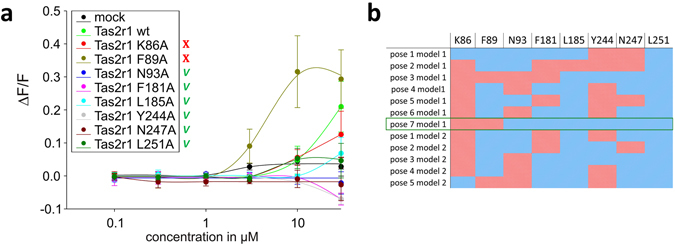
Figure 2.

(a) Dose-response relations for quinine in cells expressing point-mutated and native ggTas2r1 constructs. The y-axis shows the relative fluorescence changes (ΔF/F), and the x axis the ligand concentration in μM. Green checks indicate residues involved in the binding, red crosses residues that are not involved in the binding, based on experimental data. (b) Involvement of residues K86, F89, N93, F181, L185, Y244, N247, and L251 in binding modes of quinine in the representative poses obtained with PELE simulations: the cell is colored in blue if the residue is found to interact with the ligand and in red if there is no interaction. The predicted agonist-bound conformation, pose 7 model 1, is marked by a green frame.
