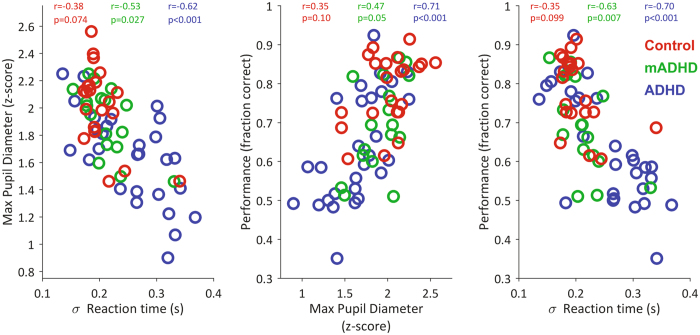
Figure 3.
Relationships between task performance, reaction time variability and maximum pupil diameter after probe presentation. Each dot corresponds to the mean session value per subject. The values of the Spearman correlation coefficient (r: rho), separately by group, are shown at the top of each plot. Reaction time variability is presented as the standard deviation of the reaction time, which in turn corresponds to the time elapsed between probe presentation and subject’s response.

