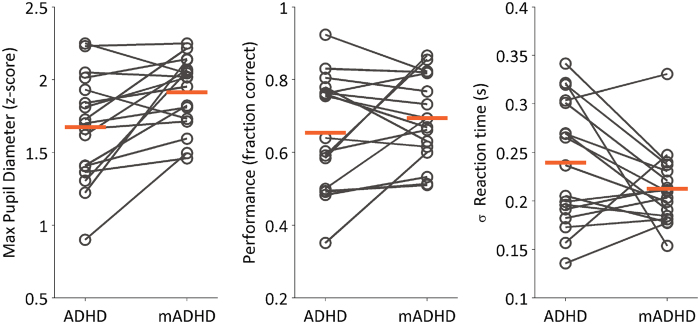
Figure 4.
Paired changes between off-medicated (ADHD) and on-medicated (mADHD) conditions, for the subset of subjects which performed the task in both conditions (n = 17). Left: Change in maximum pupil diameter measured after probe dot presentation. Center: Change in performance, expressed as the fraction of correct trials of the session. Right: Standard deviation of the subject’s reaction time (time elapsed between probe presentation and subject’s response). In all plots, each dot represents the session mean for a subject. Orange horizontal bars correspond to the group mean.

