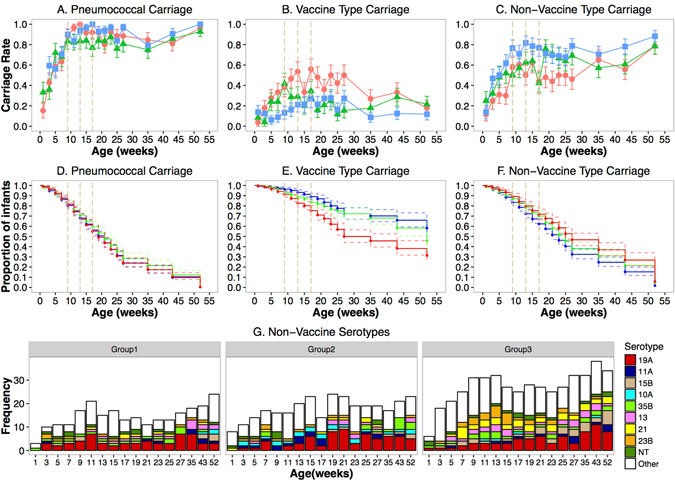
Figure 2.

Nasopharyngeal carriage dynamics of pneumococcus, vaccine and non-vaccine serotypes in the first year of life. Carriage rates of pneumococcus (A), vaccine (B) and non-vaccine serotypes (C). Kaplan Meier Survival Curve for time to first acquisition of pneumococcus (D), vaccine serotypes (E) and non-vaccine serotypes (F). Distribution of the top ten vaccine serotypes by group (G). The vertical dashed lines are the study 2, 3, and 4 month vaccination time points. P values generated from an adjusted logistic regression model. The line colour denotes the group: red for Group 1, green for group 2 and blue for Group 3.
