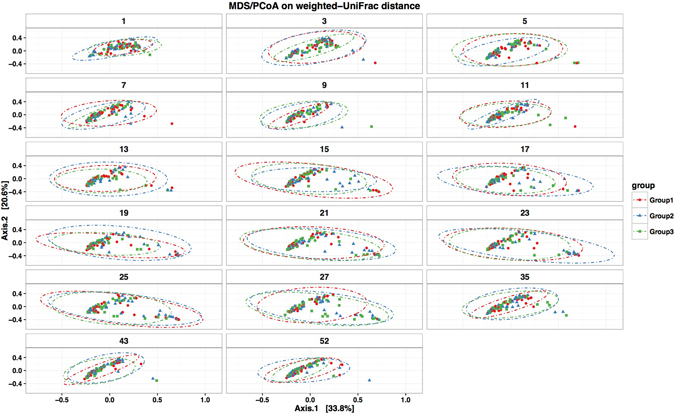
Figure 4.

Clustering of nasopharyngeal microbial profiles by group in the first year of life. The phylogenetic dis(similarities) among communities from the three vaccination groups were evaluated by MDS/PCoA on weighted-UniFrac distances. The dotted eclipses show the 95% confidence intervals for the ordinations for each group at each time point. Each circle represents the microbial profile of a nasopharyngeal specimen from an infant and the colour denotes the vaccination group; red for Group 1, green for group 2 and blue for Group 3. The distance between circles indicates the variability between nasopharyngeal microbial profiles i.e. longer distances show greater dissimilarity.
