
Figure 3.
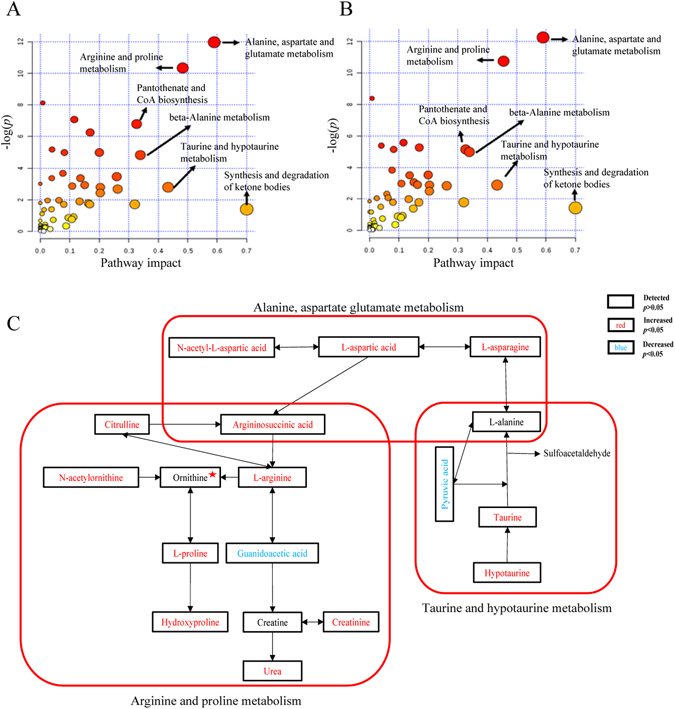
Metabolic comparison between patients and controls. (A) Changed pathways in uremia before treatments in pre-HD patients. (B) Changed pathways in uremia before treatments in pre-HFD patients. (C) Detailed changes of 18 metabolites in three important metabolic pathways when pre-dialysis patients are compared to controls. Metabolites marked with a red pentagram represent no differences between pre-HFD and the controls but are significantly reduced in pre-HD vs. the controls.