Fig. 2.

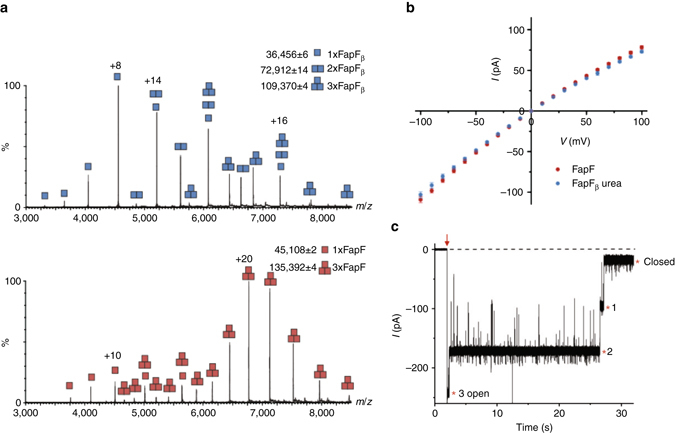
Native mass spectrometry analysis and single-channel electrophysiology of FapF. a The oligomeric state of FapFβ (data shown in blue) and full-length FapF (data shown in red). b I–V curves for the full-length FapF (red, n = 11) and FapFβ (blue, n = 6) reconstituted into planar DPhPC bilayers. The curves display mean unitary conductance values (±s.d.) from −100 mV to +100 mV in 0.1 M KCl, 20 mM potassium phosphate buffer, pH 7.0. FapFβ required the addition of 4 M urea to the recording chamber, which presumably unfolds the plug to enable insertion of an open channel. The urea was exchanged with fresh buffer before measuring conductance. c Single-channel gating trace of full-length FapF. At an applied potential of −250 mV (red arrow), full-length FapF gated in three equal steps (marked with an asterisk) which is indicative of a trimer. The dashed line represents the baseline at 0 mV
