Fig. 3.

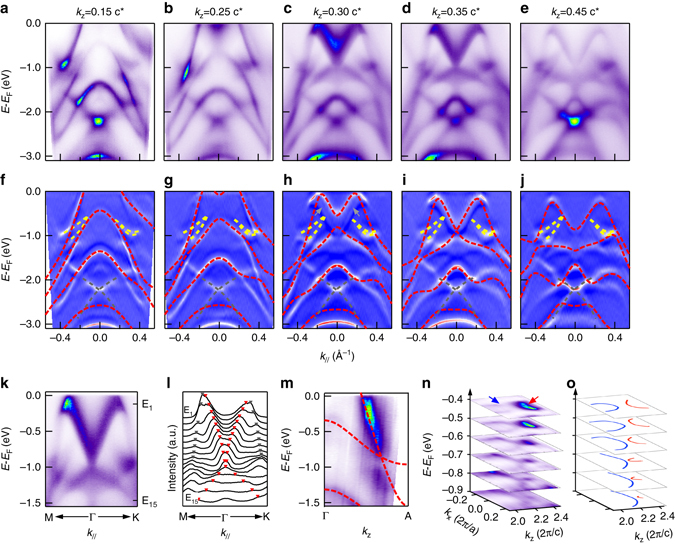
Evidence of type-II Dirac fermions in PtTe2. a–e Dispersions along the M-Γ-K direction measured at 17, 19, 21, 22, and 24 eV respectively. The corresponding k z values in the reduced BZ are labeled in each panel. f–j Comparison of EDC-curvature with calculated dispersions from first-principles calculations (red dashed lines). Surface states are highlighted by yellow and gray dashed line respectively. k In-plane Dirac cone along the M-Γ-K direction measured at 22 eV. l MDCs for the data shown in k. Red and gray markers are guides for the peak positions of inner and outer bands. m Measured dispersion at k || = 0. Red broken lines are calculated dispersions for comparison. n Three-dimensional map E–k x–k z at k y = 0, blue and red arrows indicate hole and electron pockets. The k z values are calculated in extended Brillouin Zone. o Illustration for the evolution of hole pocket (blue) and electron pocket (red) with binding energy
