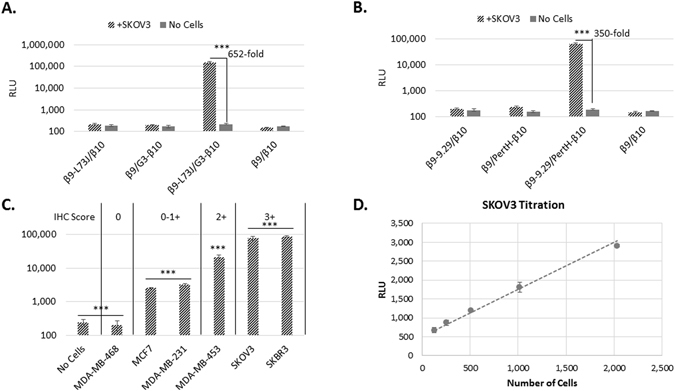
Figure 4.

Validation of TEC using purified antibody fusions. TEC with the combination of β9-L73J and G3-β10 (A) or β9-9.29 and PertH-β10 (B). None of the fusions alone, nor the combination of synthetic β9 and β10 peptides added at the same concentration as the fusions produced significant luminescence. Assay was performed as in the screen of 100 pairs except 100 nM purified binders were incubated with the cells. (C) TEC signal (normalized to signal from Cell-titer Glo 2.0 to account for cell number) obtained by incubating with 100 nM β9-L73J/G3-β10 for 1 hr, washing 3 times, adding Δ11S/Nano-Glo substrate (1:20 diluted lysate and 10 μM, respectively) on various cell lines. Reported immunohistochemistry (IHC) scores for HER2 expression are indicated at top of graph. (D) Varying numbers of SKOV3 cells were incubated for 1 hr with a homogeneous TEC detection solution (12.5 nM β9-L73J, 2.5 nM G3-β10, 1:20 dilution of Δ11S lysate, and 10 μM Nano-Glo substrate). The limit of detection was determined to be 125 cells. All data are averages from three replicate wells with the error bars indicating the standard deviation, ***p < 0.001.
