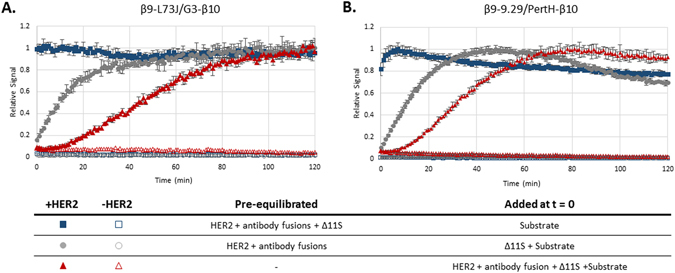
Figure 5.

Signal Kinetics of TEC. (A) The signal kinetics with the combination of β9-L73J (12.5 nM)/G3-β10 (2.5 nM) or (B) β9-9.29 (2 nM)/PertH-β10 (20 nM). The kinetics of the single-step TEC assays are compared to two different conditions pre-equilibrated with HER2: antibody fusions (gray circles), or antibody fusions and Δ11S (blue squares). The difference between the pre-equilibrated solutions indicate the kinetics of binding between antibodies and HER2 and between the peptides and Δ11S. Δ11S lysate was diluted 1:20 and Nano-Glo substrate was 10 μM in all experiments.
