Figure 4.

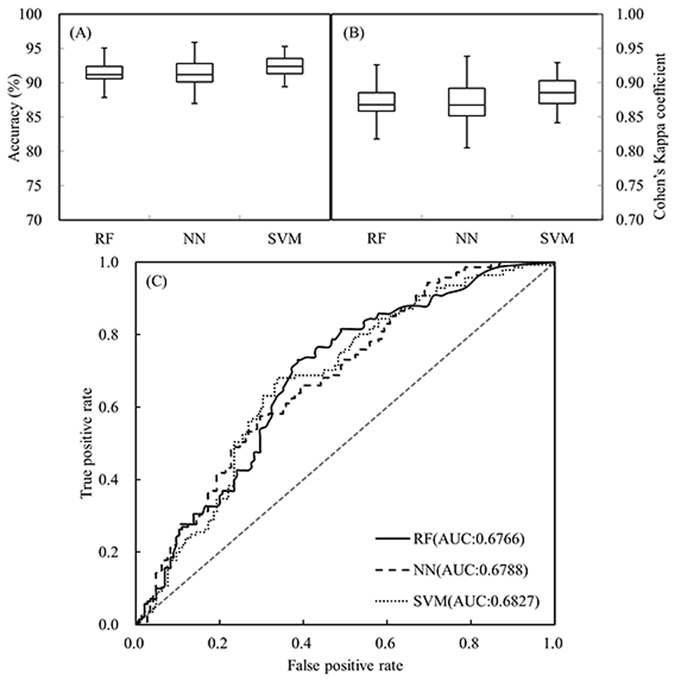
Evaluation result for different models. (A) Box-whisker plot of accuracy, (B) box-whisker plot of Kappa, and (C) the ROC curve of the three developed models. The straight dotted line in subplot (C) represents 0.5 AUC.

Evaluation result for different models. (A) Box-whisker plot of accuracy, (B) box-whisker plot of Kappa, and (C) the ROC curve of the three developed models. The straight dotted line in subplot (C) represents 0.5 AUC.