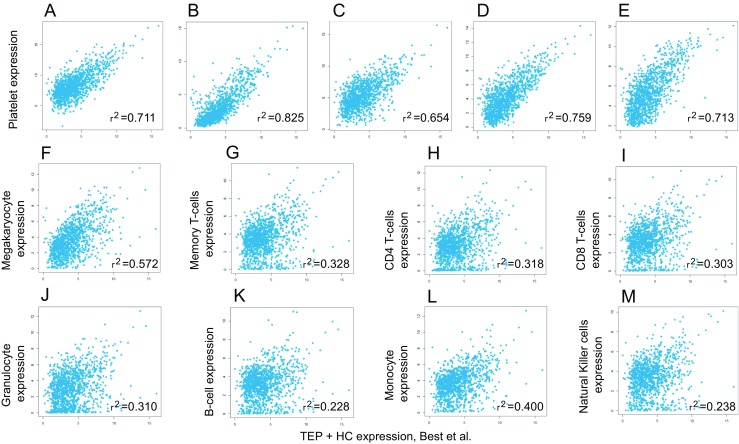
Fig. 3.

Correlation plots of TEP RNA signatures with other (a) nucleated blood cells. Correlation plots between platelets sequenced by Best et al. compared with platelet RNA expression levels from different studies and compared with RNA expression from different blood cells. (a) Platelets from Bray et al. [82]. (b) Poly A selected RNAs from platelets from Kissopoulou et al. [83]. (c) Ribosomal RNA-depleted platelets from Kissopoulou et al. [83]. (d) Platelets from Rowley et al. [84]. (e) Platelets from Simon et al. [85]. (f) Megakaryocyte [86]. (g) Memory T-cells [87]. (h) CD4 T-cells [87]. (i) CD8 T-cells [87]. (j) Granulocytes [87]. (k) B-cells [87]. (l) Monocytes [87]. (m) Natural killer cells [87]
