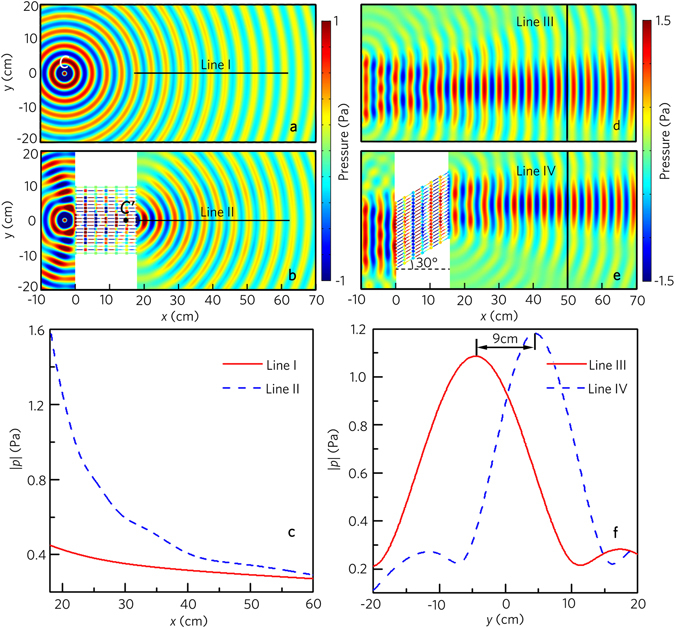
Figure 4.

Acoustic invisibility performances. Simulated acoustic pressure field distributions (a) without and (b) with the acoustic metafiber bundle illuminated by an incident cylindrical wave at 8.0 kHz. The cylindrical acoustic source is located at (−3 cm, 0) in Cartesian coordinates. (c) Pressure amplitude distributions along the lines I and II in (a and b). Simulated acoustic pressure field distributions (d) without and (e) with the acoustic metafiber bundle illuminated by the normally plane wave at 8.0 kHz, and the acoustic metafiber bundle in e is rotated 30°. (f) Pressure amplitude distributions along the lines III and IV in (d and e).
