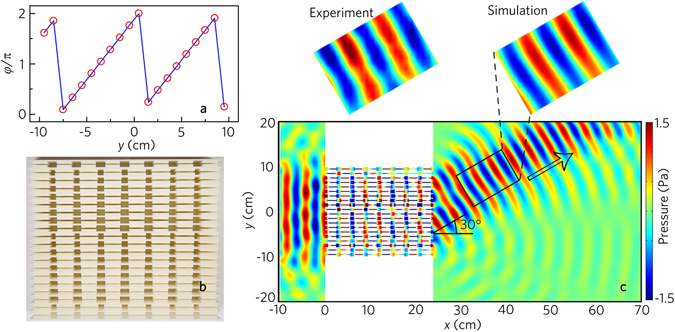
Figure 7.

Acoustic negative refraction with a beam. (a) Distribution of twenty acoustic metafibers along y direction as indicated by their discrete phase shift (twenty red hollow dots) resembling the desired phase profile φ(y) (blue line). (b) Photograph of the designed metafiber bundle. (c) Simulated and measured acoustic pressure field distributions with the acoustic metafiber bundle illuminated by the normally incident plane wave at 8.0 kHz. Black arrow in (c) refers to the theoretical value of the refraction.
