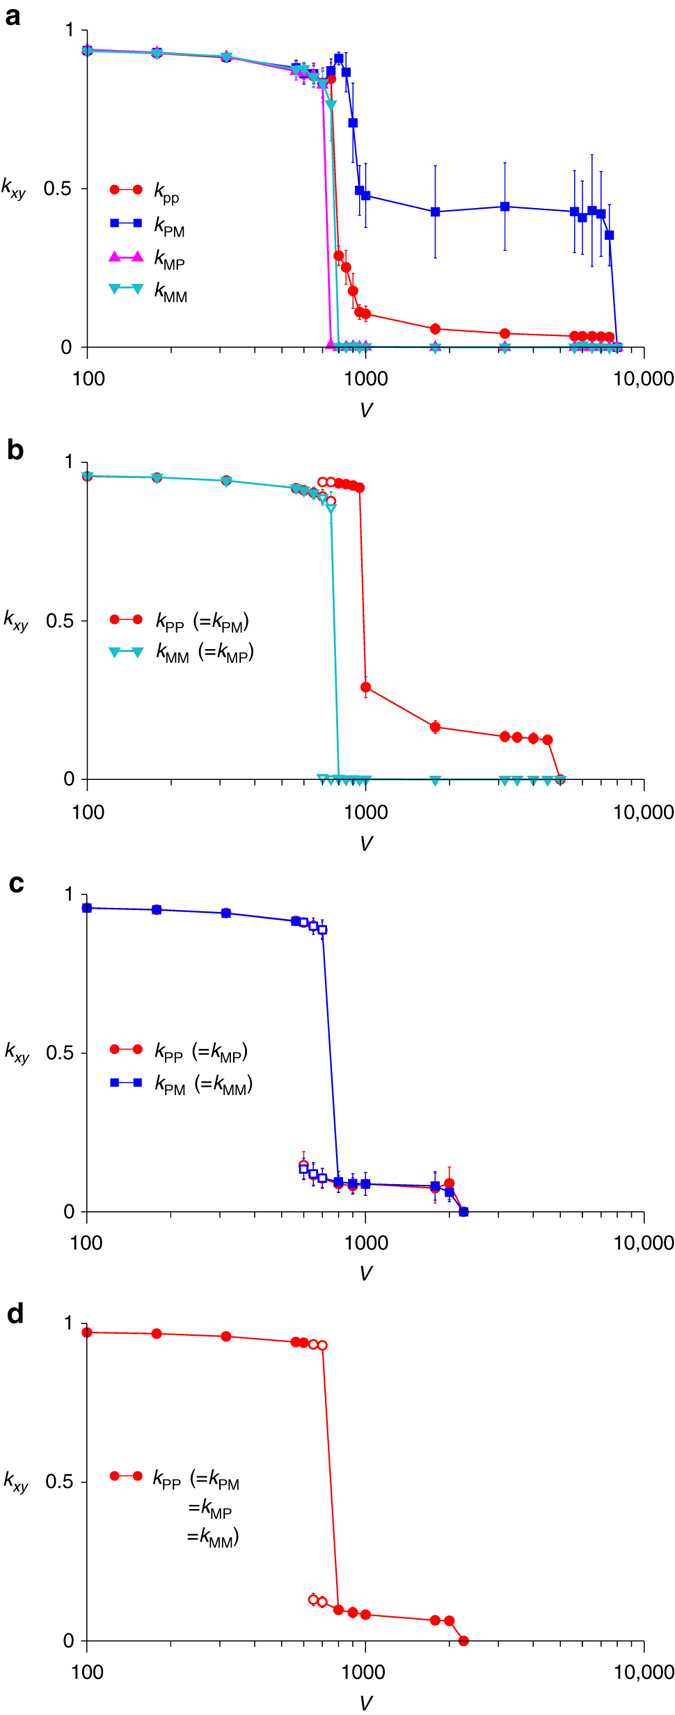
Fig. 2.

Equilibrium average catalytic activities (k xy) as functions of cell size (V). The values of k xy were first averaged over all replicators at each time point. Then, the average (symbols) and s.d. (error bars) of k xy overtime were calculated after equilibration. The open symbols indicate metastable states (i.e., states reachable from different initial conditions with no state transition observed within 107 time steps; a replicator decays approximately with a probability d per time step). For visibility, the non-catalytic strand (if it evolves) was assumed to be always the minus strand. Parameters: m = 0.01, d = 0.02, N = 50V. a. The full model (no symmetry imposed). b. The model in which kinetic symmetry is imposed (i.e., k PP = k PM and k MP = k MM). c. The model in which functional symmetry is imposed (i.e., k PP = k MP and k PM = k MM). d. The model in which both kinetic and functional symmetry are imposed (i.e., k PP = k PM = k MP = k MM)
