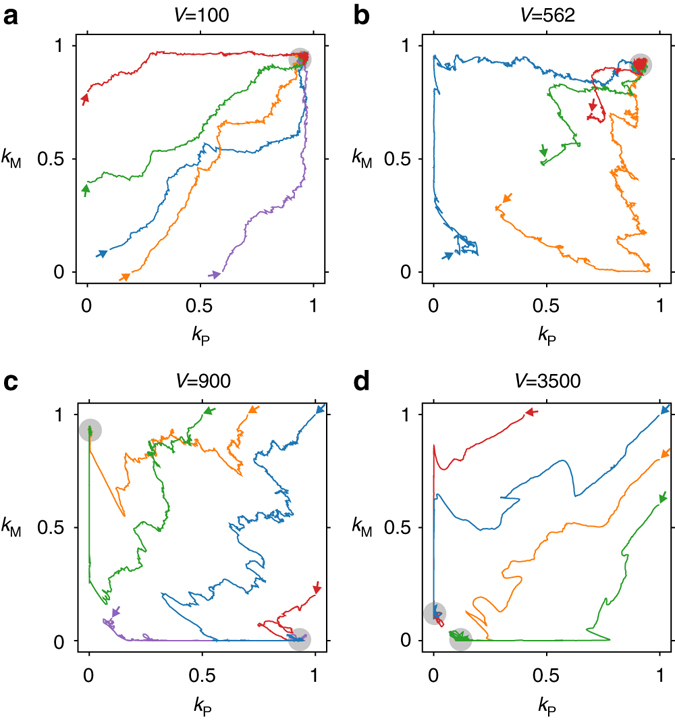
Fig. 4.

Evolutionary trajectories of the catalytic activities of the plus and minus strands (k P and k M, respectively). The values of k P and k M were averaged over all replicators at each time point. The arrows indicate different initial conditions; grey circles indicate equilibria. The values of V are shown above each graph: a. V = 100; b. V = 562; c. V = 900; d. V = 3500. The other parameters were the same as in Fig. 2. The data were obtained with the model in which kinetic symmetry is imposed (i.e., k PP = k PM and k MP = k MM) so that evolutionary trajectories can be depicted in a plane
