
Fig. 1.
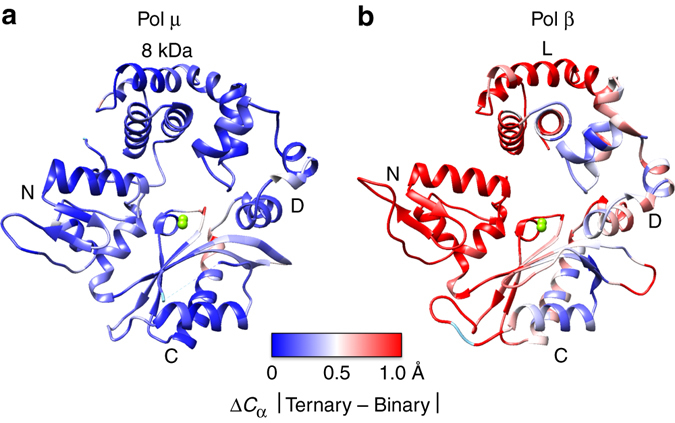
Global conformational changes (ΔC α) upon binary-to-ternary complex transition in (a) pol μ and (b) pol β. The structures shown are the ternary complexes of each enzyme. The protein backbones are colored as a heat map from blue to red corresponding to changes in C α positions on a scale from 0 to 1.0 Å, calculated from an alignment of the binary (PDB ids 4LZG and 3ISM for pol μ and pol β, respectively) and ternary (PDB ids 4M04 and 2FMS for pol μ and pol β, respectively) complexes using the Matchmaker tool in the Chimera package46. All the C α of the respective pol μ structures were used to perform the alignment, as pol μ does not display subdomain motions (RMSD, 0.23 Å). In contrast, since the N-subdomain of pol β undergoes repositioning when a nucleotide binds to form the ternary complex (Fig. 4a in ref. 20), the alignment was restricted to the other pol β subdomains (RMSD, 0.86 Å, 224 residues). The domains/subdomains are indicated; the polymerase domain includes the D-, C-, and N-subdomains corresponding to the thumb, palm, and fingers of right-handed polymerases20, as well as the 8-kDa and lyase (L) domain of pol μ and β, respectively. Active site metals are shown as green spheres and the ends of the disordered loop region in pol μ are shown connected by a dashed line (cyan)