
Figure 5.
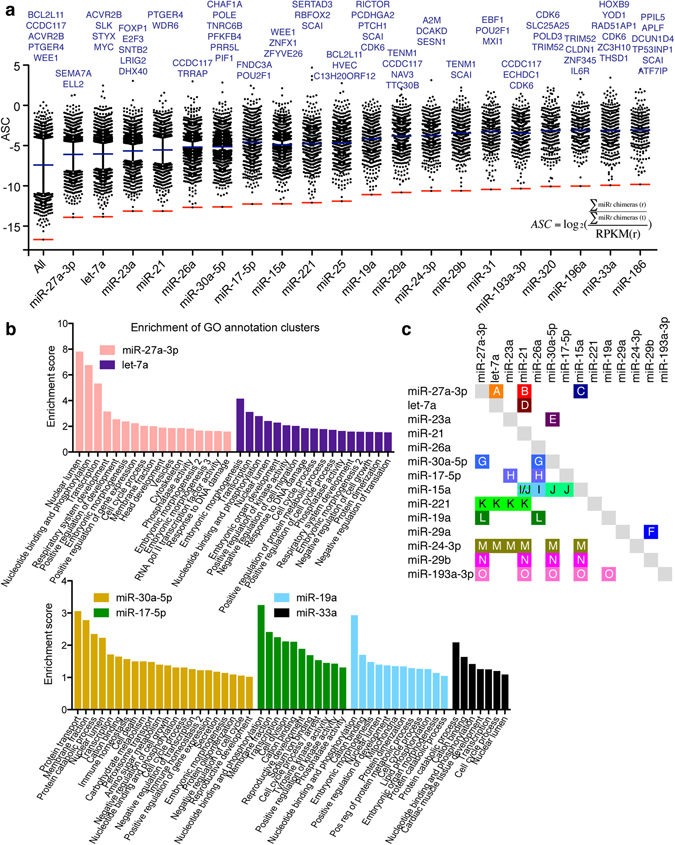
Gene targeting profile for the most abundant miRNAs. (a) ASC values are plotted for the most abundant miRNA families. The most highly targeted mRNAs are noted. Blue lines indicate mean values (excluding non-targeted mRNAs); red lines indicate lower level of quantification. In the calculation of ASC values, f denotes the miRNA family of interest, r the mRNA in question and t total number. (b) GO analysis on gene sets with high ASC values for selected miRNA families. Enrichment scores of annotation clusters are shown. (c) Cooperativity of miRNA families in mRNA targeting. Pairwise (upper right) or multi-family (lower left) miRNA family targeting cooperatives are highlighted. Color-coding and letter designation refers to k-means clusters of genes by miRNA specific ASC values (refer to Figure S5b–d). Highlighted groups occurred in all three iterations of analysis, except for groups C, I and K that occurred in only two.