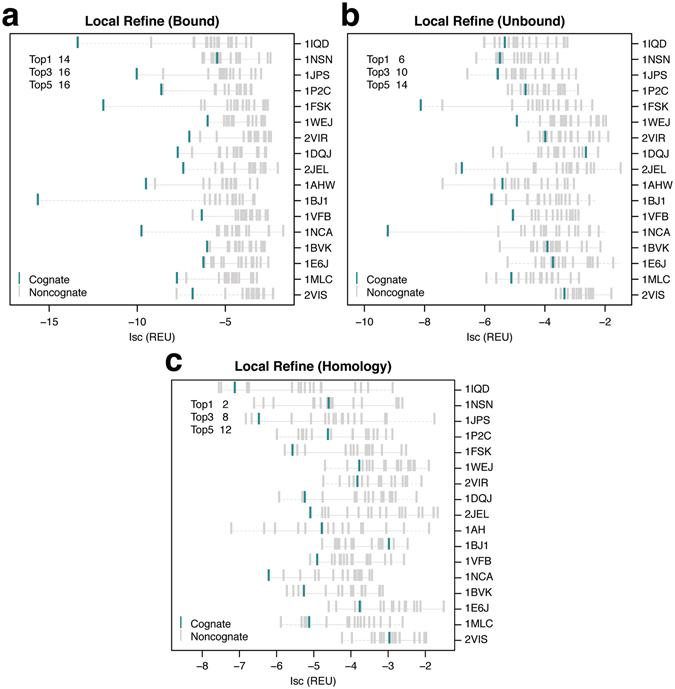
Figure 3.

Ranks of cognate complexes among local refine antibody–antigen models. Interface scores (Isc) of the top-scoring cognate (turquoise) and non-cognate (grey) local refine models for (a) bound, (b) unbound, and (c) homology antibody–antigen complexes. Each row indicates a single antigen represented by the PDB ID of the bound complex. Antigens are sorted based on decreasing experimental binding affinities for their native antibodies (top to bottom). The top left corner shows the number of antigens where the cognate antibody complex is ranked in the top 1, 3, and 5 top-scoring cognate and non-cognate models generated for the antigen.
