
Figure 7.
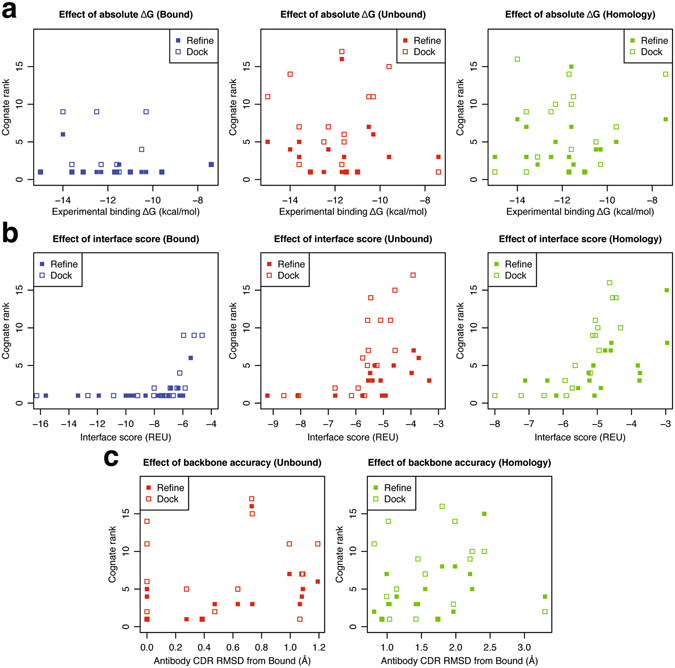
Effects of experimental binding affinities, interface scores, and antibody backbone accuracy. Correlation plots comparing ranks of the top-scoring cognate models to (a) experimental binding affinities (ΔG), (b) interface scores, and (c) antibody CDR backbone accuracy for bound (blue), unbound (red), and homology (green) complexes. Models generated using local refine and local dock are shown as filled and empty squares, respectively.