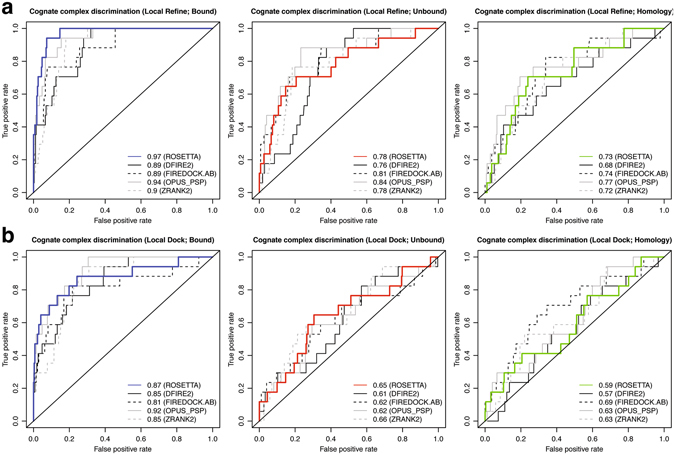
Figure 8.

Receiver Operating Characteristic (ROC) curves for binder discrimination. ROC curves using Rosetta interface score of the top-scoring model as the classifier for (a) local refine, and (b) local dock. The native cognate antibody–antigen interaction pairs are true positives. ROC curves computed using four additional potentials: DFIRE2, FIREDOCK.AB, OPUS_PSP, and ZRANK2 are shown for comparison. The bottom right corner of the plot shows the area under the curve (AUC) for Rosetta bound (blue), unbound (red), and homology (green) complexes compared to the other potentials.
