Figure 3.

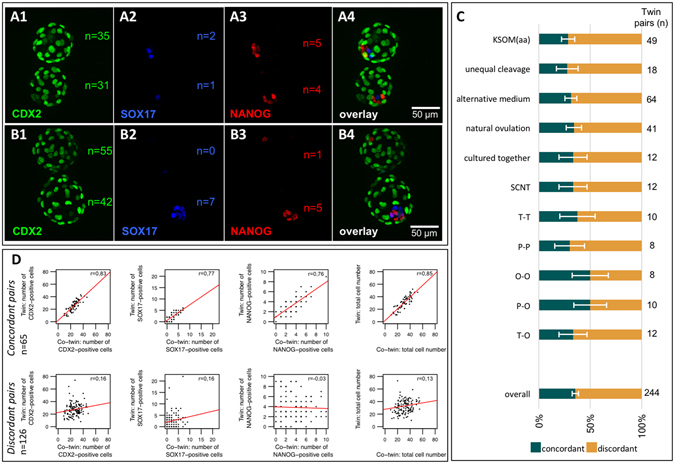
Cell lineage analysis of blastocysts. Immunoconfocal fluorescence images of representative MZ twin blastocysts, co-stained for cell lineage-specific markers: CDX2 for TE (A1,B1), SOX17 for pEnd (A2,B2) and NANOG for EPI (A3,B3). Microscope objective 20X, 0.75 N.A. Pairs were scored as either “concordant” (A) or “discordant” (B) based on the “9-2-2 criterion” (see main text). The proportions of concordant and discordant pairs were similar irrespective of culture medium, ovarian stimulation, co-culture, sperm-entry point and embryo conformation at the four-cell stage (tetrahedral, T; planar, P; open chain, O). The error bars associated with the proportions are standard deviations. (C). Linear correlation analysis (Pearson’s r) of the cells counted in the lineage compartments of each MZ pair shows that the main contributor to the discordance was the EPI lineage (D).
