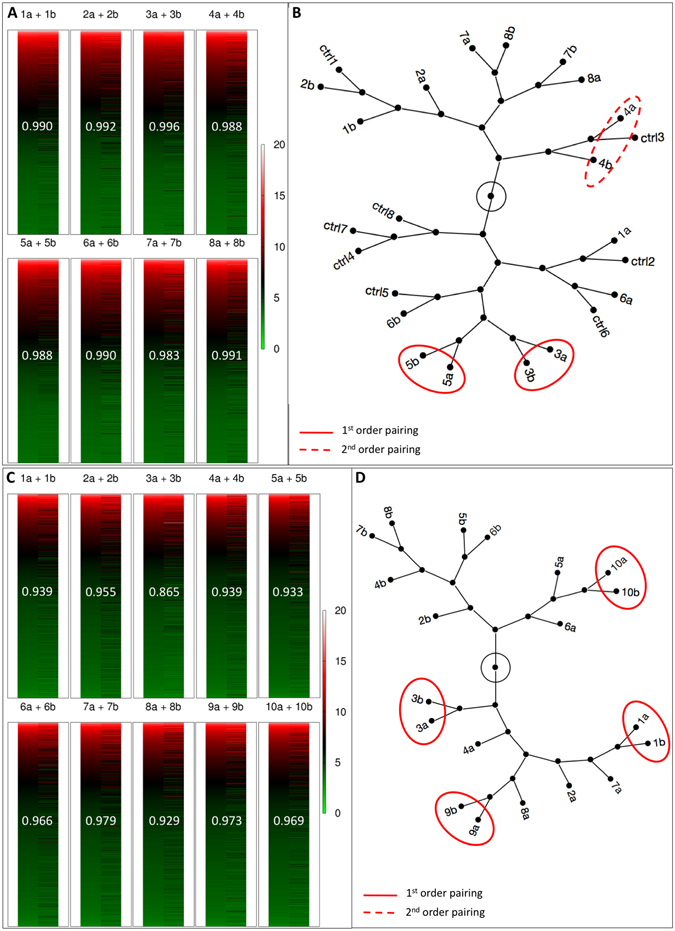
Figure 5.

Transcriptome analysis of MZ twin pairs. Individual transcriptomes are shown as heat maps, with higher expression coded in red and lower expression coded in green, and linear correlation coefficient written on the heat maps (A,C). Constellation maps of the transcriptomes of individual blastocysts (B) and individual two-cell stage blastomeres (D) identified with both a number (for the original embryo subjected to bisection) and a letter (for the two members resulting from bisection). Unmanipulated embryos in B are labeled as controls (ctrl). The transcriptomes were subjected to hierarchical clustering analysis to see if they would return the original pair associations (e.g. 1a-1b, 7a-7b).
