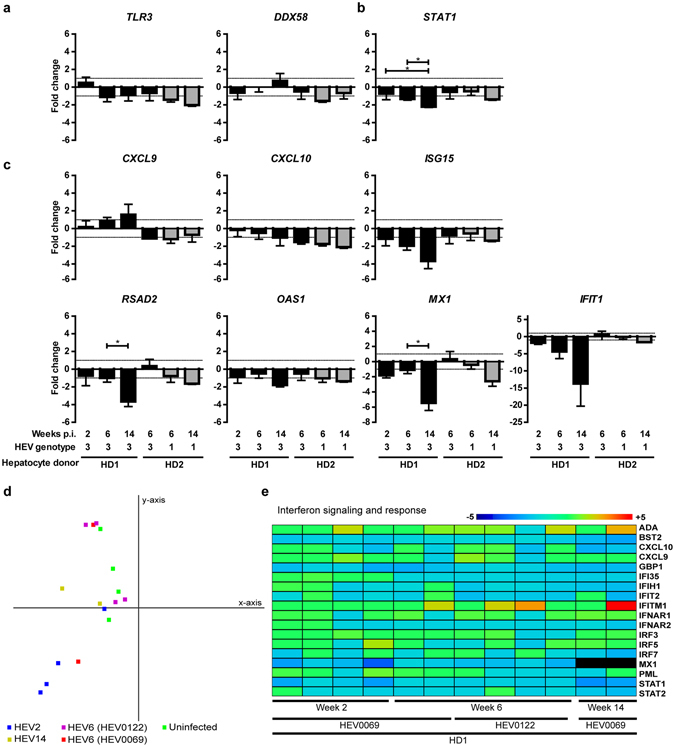
Figure 2.

Minimal intrahepatic interferon-stimulated gene induction in HEV infected human-liver chimeric mice, between weeks 2 to 14 post infection. Whole chimeric-liver RNA was isolated from HEV gt3 and gt1 infected mice and analyzed for the human specific gene expression of sensing molecules TLR3 and DDX58 (a), transcription factor STAT1 (b), and interferon stimulated genes CXCL9, CXCL10, ISG15, RSAD2, OAS1, MX1 and IFIT1 (c) using qRT-PCR. Groups consist of n = 4, 6, 4, 3, 6 and 4 mice from left to right (a–c). Given values on y-axes are fold changes over HEV RNA negative chimeric-livers transplanted with the same hepatocyte donor. X-axes shows weeks post infection, HEV genotype, and hepatocyte donor. Significance was assessed within groups of the same hepatocyte donor using Krukskal-Wallis one-way Anova with Dunnett’s Multiple comparison test. *P < 0.05, Gray bars indicate HEV gt1, black bars HEV gt3 (a–c). In-depth human gene expression analysis was performed on RNA from chimeric mouse livers before infection, and after 2, 6 and 14 weeks of HEV gt3 infection using nCounter® Human Immunology V2 panel. Principal component 1 (x-axis) and 2 (y-axis) comprise 49% of the variance between samples using all non-cross reactive genes (d). Uninfected samples are indicated in green, infected samples are indicated in blue, red (HEV0069), purple (HEV0122) and yellow and by the number of weeks infected HEV2, HEV6, HEV6, HEV14, respectively (d). Heatmap shows fold change over average of 4 uninfected mice for interferon signaling and response genes (e). Gene legend is indicated on the right side and sample legend below the heatmap (e). Dark red indicates ≥ 5 fold change, and dark blue ≤ 5 fold change (e).
