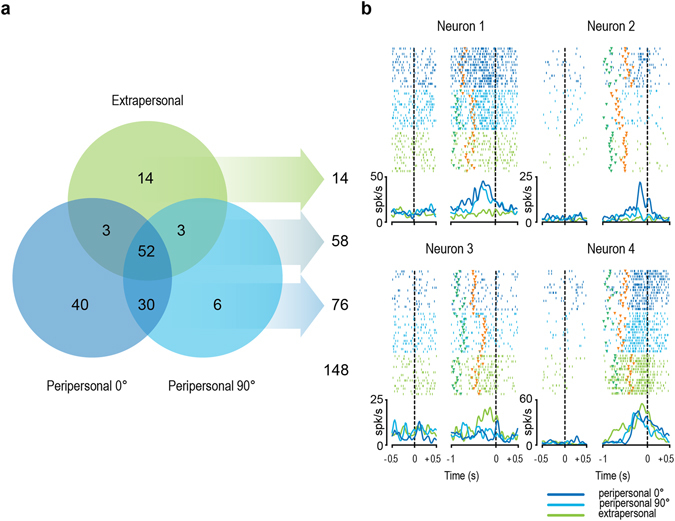
Figure 2.

Spatial and/or viewpoint selectivity of the recorded MNs. (a) Venn diagram illustrating the number of MNs significantly activated during single or multiple conditions. (b) Examples of MNs with different spatial and viewpoint selectivity. For each neuron, rasters and spike-density function are aligned (dashed lines) on object presentation (left part) and, after the gap, on the beginning of object-pulling phase (right part). Markers: green, end of the cue sound (go-signal); orange, detachment of the experimenter’s hand from the starting position.
