Figure 2.

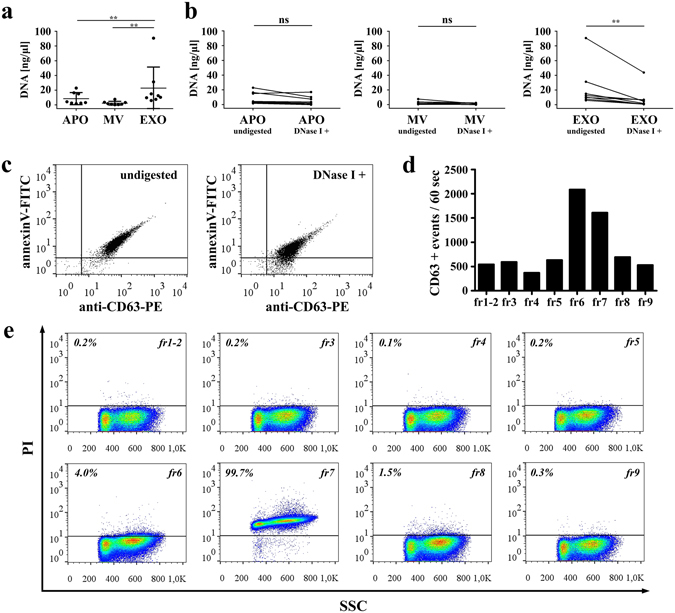
Analysis of ciprofloxacin-induced release of DNA associated with extracellular vesicles (EVs). (a) DNA content of size-based EV fractions determined with/without DNase I digestion of EVs. Concentration values represent the amount of EV-associated DNA (eluted in 3 0 µL) isolated from the conditioned medium of 2.5 × 10⁷ Jurkat cells. Plotted values are presented as the mean+/− S.D. (error bars) of 8 independent experiments. (**P < 0.01, Friedman test, One-way ANOVA). (b) DNA amounts before and after the digestion of EVs by DNase I. The paired measurements (n = 8) for APOs, MVs and EXOs are indicated by lines (**P < 0.01, Wilcoxon signed rank test). APO: apoptotic body, MV: microvesicle, EXO: exosome (c) The presence of EXOs both in undigested and DNase I digested samples was confirmed by flow cytometry. Latex-bound EXOs were stained with annexinV-FITC and an anti-CD63-PE antibody. Dot plots are representative of three independent experiments. (d) OptiprepTM density gradient fractions of the 100,000 g pellet (containing EXOs) were re-pelleted, conjugated onto latex beads and stained with an anti-CD63-PE antibody for flow cytometry. (e) The same latex-bound OptiprepTM density gradient fractions were also stained by propidium iodide (PI). The percentages of PI positive events are shown above a threshold (horizontal line, determined by measuring labeled latex beads without conjugated density gradient fractions).
