
Figure 4.
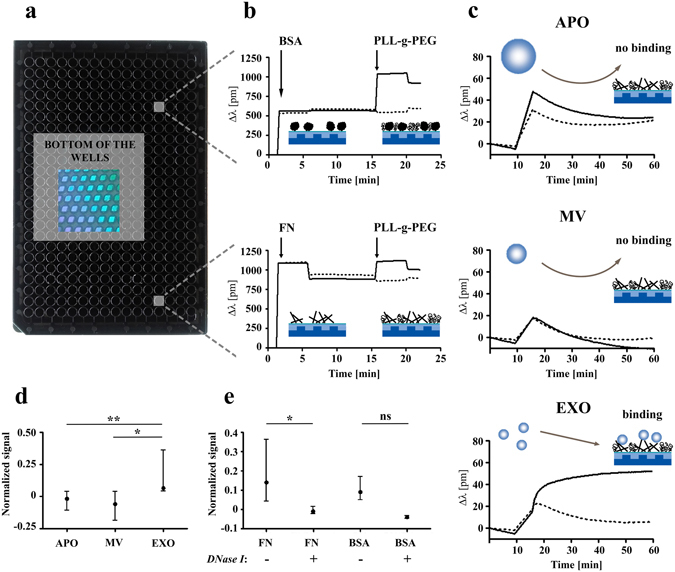
Label-free optical biosensor analysis of surface adhesion of extracellular vesicles (EVs). (a) Photograph of an Epic microplate (384-well) is shown containing biosensors (2 × 2 mm nano-grating embedded in a high-refractive index waveguiding film) at the bottom of each well. Biosensors are imaged from the back of the plate and are visible due to diffraction. (b) Microplate wells were coated with bovine serum albumin (BSA) as a control protein or with fibronectin (FN) resulting in a shift in the resonant wavelength (Δλ). Microplate wells were equilibrated with PBS, then BSA or FN were added to the wells (indicated by the first arrows). After one hour incubation with BSA or FN, Δλ was recorded for 5 min. Then, unbound protein was washed out with PBS, and Δλ was measured again for 10 min. Then, PLL-g-PEG was used in order to block the non-specific binding sites of wells. The BSA and FN adsorption signals without addition of PLL-g-PEG (PBS only) are indicated as dashed lines, while adsorption of the blocking PLL-g-PEG in BSA- or FN-coated wells is shown by continuous line. After 30 min incubation with PLL-g-PEG, Δλ was recorded for another 5 min (starting points are indicated by the second arrows), and finally PLL-g-PEG was changed to PBS. (c) Adsorption of apoptotic bodies (APOs), microvesicles (MVs) and exosomes (EXOs) onto FN + PLL-g-PEG surfaces (continuous lines) or onto surfaces with adsorbed PLL-g-PEG only (dashed lines). (d) The Δλ values of EV adsorption onto PLL-g-PEG were subtracted from adsorption values onto FN + PLL-g-PEG, and were divided by the Δλ value of EV adsorption onto bare surfaces (as a straightforward normalization with the mass concentrations of various samples). These normalized signal values are presented as the mean+/− S.D. (error bars) of three independent experiments (**P < 0.01 between APOs and EXOs, *P < 0.05 between MVs and EXOs, Mann-Whitney U-test). (e) Comparison of EXO adsorption with/without DNase I digestion onto FN + PLL-g-PEG and onto BSA + PLL-g-PEG surfaces. Normalized signal values are presented as the mean+/− S.D. (error bars) of three independent experiments. Difference was significant in the case of FN surface (*P < 0.05, Mann Whitney U-test). PLL-g-PEG: poly(L-lysine)-graft-poly(ethylene glycol).