
Figure 3.
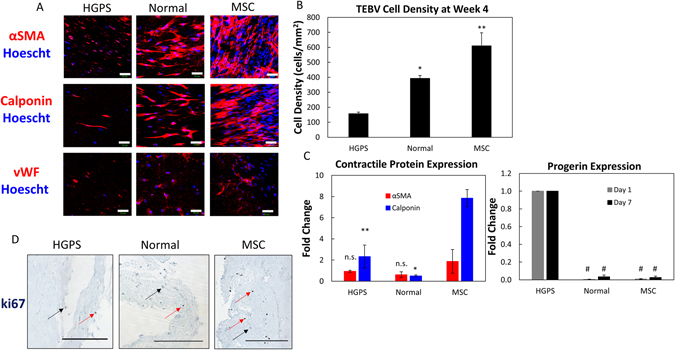
Structural characterization of TEBVs fabricated from MSC or iPSC-derived SMC TEBVs from healthy and Progeria patients. (A) Representative images of immunofluorescence staining with α-smooth muscle actin, calponin, and vWF antibodies at week 4 of perfusion on TEBVs fabricated from HGPS iSMCs, normal iSMCs, and MSCs and seeded with hCB-ECs in the lumen. (Scale bar, 50 μm). (B) Quantification of cell density from A based on the number of nuclei per field area. (C) qRT-PCR of Progerin, alpha-smooth muscle actin and calponin gene expression on MSC, HGPS iSMC and normal iSMC TEBVs. Progerin expression was set at 100% for HGPS iSMC TEBV samples at day 1 and day 7. Alpha-smooth muscle actin and calponin gene expression in TEBVs at day 7 of perfusion culture were normalized to TEBVs on day 1 of perfusion culture. Data normalized to GAPDH expression. (D) Histochemical analysis of HGPS iSMC, normal iSMC, and MSC TEBVs at week 1 with ki67. Red arrows indicate ki67 positive cells and black arrows indicate ki67 negative cells (Scale bar, 200 μm). n = 3 TEBVs for each TEBV cell type. *P < 0.05, **P < 0.01, #P < 0.001, n.s. =not significant.