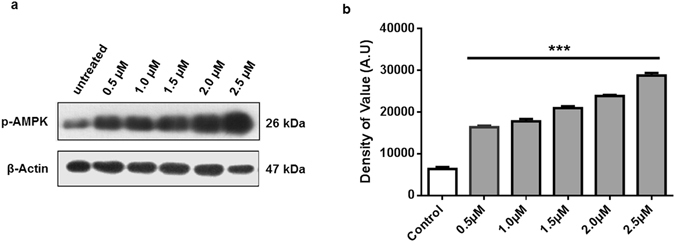
Figure 3.

(a) p-AMPK activation after treatment with osmotin. In vitro treatment with increasing concentrations of osmotin, 0.5 µM, 1 µM, 1.5 µM, 2.0 µM and 2.5 µM, resulted in an increase in p-AMPK activation 20 minutes after treatment. (b) Histogram showing the values of p-AMPK activation at different concentrations of osmotin: 0.5 µM, 1 µM, 1.5 µM, 2.0 µM and 2.5 µM. Full-length blots are included in supplementary information file. Significant at p < 0.05. *Significantly different from the control untreated group.
