Figure 4.

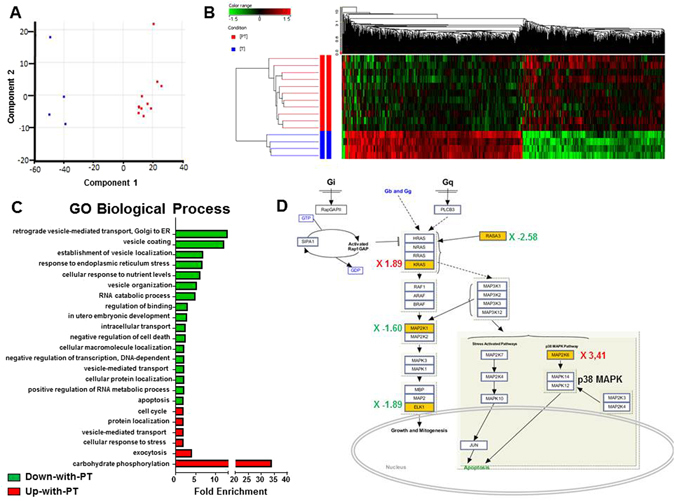
Prematurity induces a distinct transcriptome profile in ECFC. (A) Principal component analysis (PCA) plot of the gene expression profiles across 4 CT (blue) and 11 PT-ECFC (red). Each point represents a single ECFC sample, whereas the distance between points is indicative of the global gene expression similarity, such that similar array profiles are positioned closer together. (B) The hierarchical clustering for differentially expressed genes detected by whole-genome microarray analysis of the mRNA obtained from CT- and PT-ECFC. Genes in red: increased expression; genes in green: decreased expression. (C) Fold enrichment over chance for the Gene Ontology (GO) biological process of the Up-with-PT (red) or Down-with-PT (green) gene lists using DAVID (fold change ≥ 2, p ≤ 0.001). (D) The MAPK pathway in PT-ECFC. Pathway analysis was performed using SEA GeneSpring resources; differentially expressed genes are shown (yellow boxes, p ≤ 0.05), with the induction ratio derived from the microarray data.
