Figure 6.

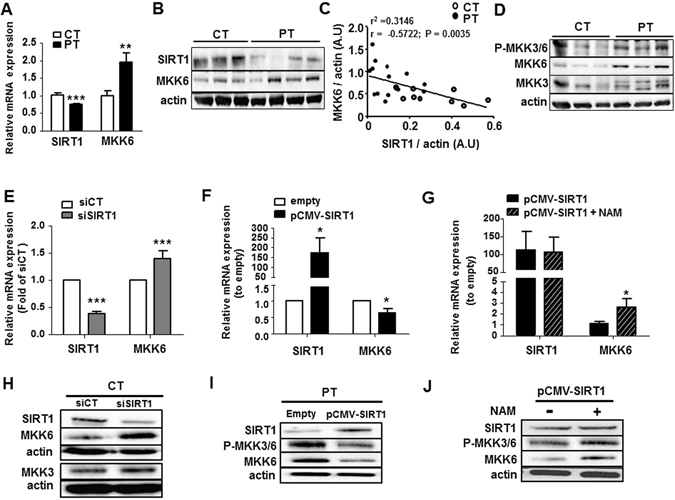
SIRT1 defect increased pMKK3/6 by increasing MKK6 levels. The SIRT1 and MKK6 mRNA (A) and protein (B) expression levels in CT-and PT-ECFC were assessed via RT-qPCR and Western blot analysis, respectively. (A) The impact of PT on the mRNA level (relative expression to CT; N = 13 CT vs. 16 PT). (B) The impact of PT on the protein level (relative expression to actin; N = 18 CT vs. 26 PT, representative blot). (C) The correlation between MKK6 and SIRT1 protein expression levels. Every plot represents a single sample collected from a patient (N = 24). (D) Western blot analysis of MKK3/6 activation in CT- and PT-ECFC was performed by the determination of phosphor-MKK3/6, MKK3 and MKK6 (N = 118 vs 28). (E–J) The impact of SIRT1 modulation on the activation of MKK3/6. SIRT1 and MKK6 mRNA (E–G) and protein (H–J) expression levels, along with MKK3/6 phosphorylation, were assessed via RT-qPCR and Western blot analysis, respectively. (E,H) The impact of SIRT1 silencing on the mRNA and protein expression of CT-ECFC (relative expression to scrambled; N = 12). (F,I) The impact of SIRT1 overexpression on mRNA and protein expression in PT-ECFC (relative expression to empty; N = 7 and 11, respectively). (G,J) The impact of NAM on mRNA (relative expression to empty, N = 8) and protein expression (relative expression to SIRT1-transfected cells; N = −6–9) in PT-ECFC overexpressing SIRT1. The data for all of the bar graphs are presented as the means ± SEM. (Statistical analysis: t-test; *p < 0.05, **p < 0.01, ***p < 0.001). All blots correspond to representative images of blot bands.
