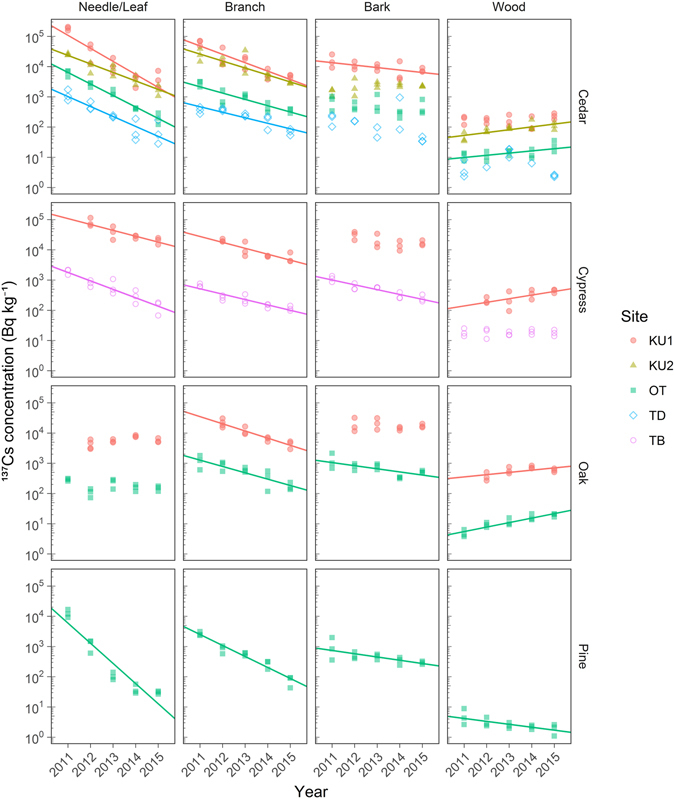
Figure 2.

Time series of needle/leaf, branch, bark, and wood 137Cs concentrations at each study plot. For individual samples, log-transformed 137Cs concentrations above the detection limit were plotted against the sampling year. Maximum likelihood regression analysis was performed for data below the detection limit38. Significant trends between the log-transformed concentration and sampling year (linear regression analysis, p < 0.05) are denoted by solid lines. The sampling period was August–September in each year except at KU2-S in 2011 (November 2011) and TB-H in 2011 and 2012 (February 2012 and February 2013, respectively). The radiocesium concentration was decay corrected to September 1 of each sampling year.
