
Figure 3.
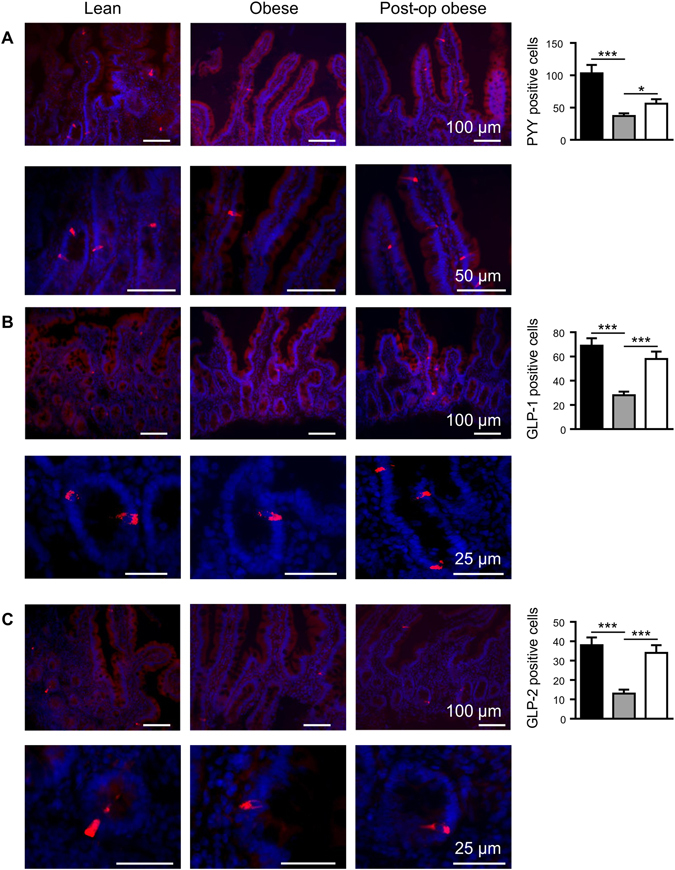
PYY, GLP-1 and GLP-2 protein expression in human duodenal biopsies. Profile of gut hormones, PYY (A), GLP-1 (B) and GLP-2 (C) was determined in the duodenal biopsies of lean (■), obese ( ) and post-operative obese, (□) by immunohistochemistry. Bar charts (on the right) show number of cells counted expressing the gut hormones. Statistical significance was determined by a One-way ANOVA with differences between means identified using a Holm-Sidak multiple comparison post-test test where *p < 0.05, ***p < 0.001. Scale bars are either 100, 50 or 25 µm. Nuclei are stained blue with 4′,6-diamidino-2-phenylindole (Dapi).