Fig. 1.

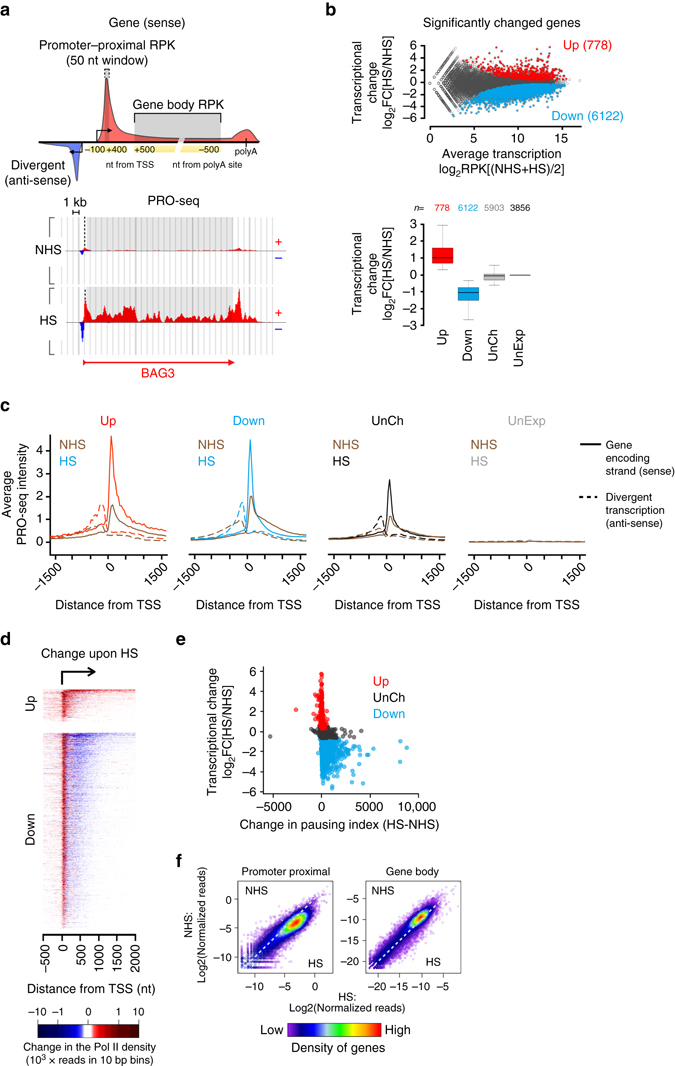
Rapid transcriptional reprogramming of genes is defined at the step of promoter-proximal pause-release. a Schematic representation (upper panel) of promoter-proximal region (−100 to +400 nt from TSS) from which the Pol II pause site was scored as a 50-nt window, and gene body (+500 nt from TSS to −500 nt from polyA site) from which the average Pol II density across the coding region was measured. Divergent transcription is depicted upstream of the gene, and the transcription initiation sites towards the sense and anti-sense are indicated with arrows. The lower panel illustrates the strand-specific scanning of Pol II density at promoter–proximal (dashed line) and gene body (grey box) regions at BAG3 gene prior to (NHS) and upon (HS) heat shock. b MA-plot (upper panel) showing the heat-induced transcriptional change at the coding regions of individual genes. Genes with significantly upregulated (Up) or downregulated (Down) transcription upon HS are colored red and blue, respectively. The lower panel indicates the number and transcriptional change of genes that were significantly upregulated, downregulated or remained unchanged (UnCh) upon acute heat stress, or that were not transcribed (UnExp) prior to or upon HS in human K562 cells. c Strand-specific average intensity of transcriptionally engaged Pol II at the TSS of upregulated (Up), downregulated (Down), unchanged (UnCh) and unexpressed (UnExp) genes. Coding strand is indicated with solid, divergent strand with dashed line. d Heatmap depicting the change in the Pol II density at the coding strand of significantly changed genes upon acute stress. e The change in the pausing index at individual upregulated, downregulated and unchanged genes. f Comparison of PRO-seq reads prior to (NHS) and upon heat shock (HS) at promoter-proximal and gene body regions of each gene. The density of genes in the scatter plot is indicated with the color scale
